
COSMOS Desktop
COSMOS Desktop builds on my work that produced COSMOS One, which presented multiple data views in a fixed, tab-based user interface. To build COSMOS Desktop, I made three major changes:
- I broke apart the visualizations in each tab and encapsulated them in individual components;
- I added the ability to import data from a variety of sources; and
- I developed a user interface for building user-defined visualizations by dragging and dropping data sources and visualization components.
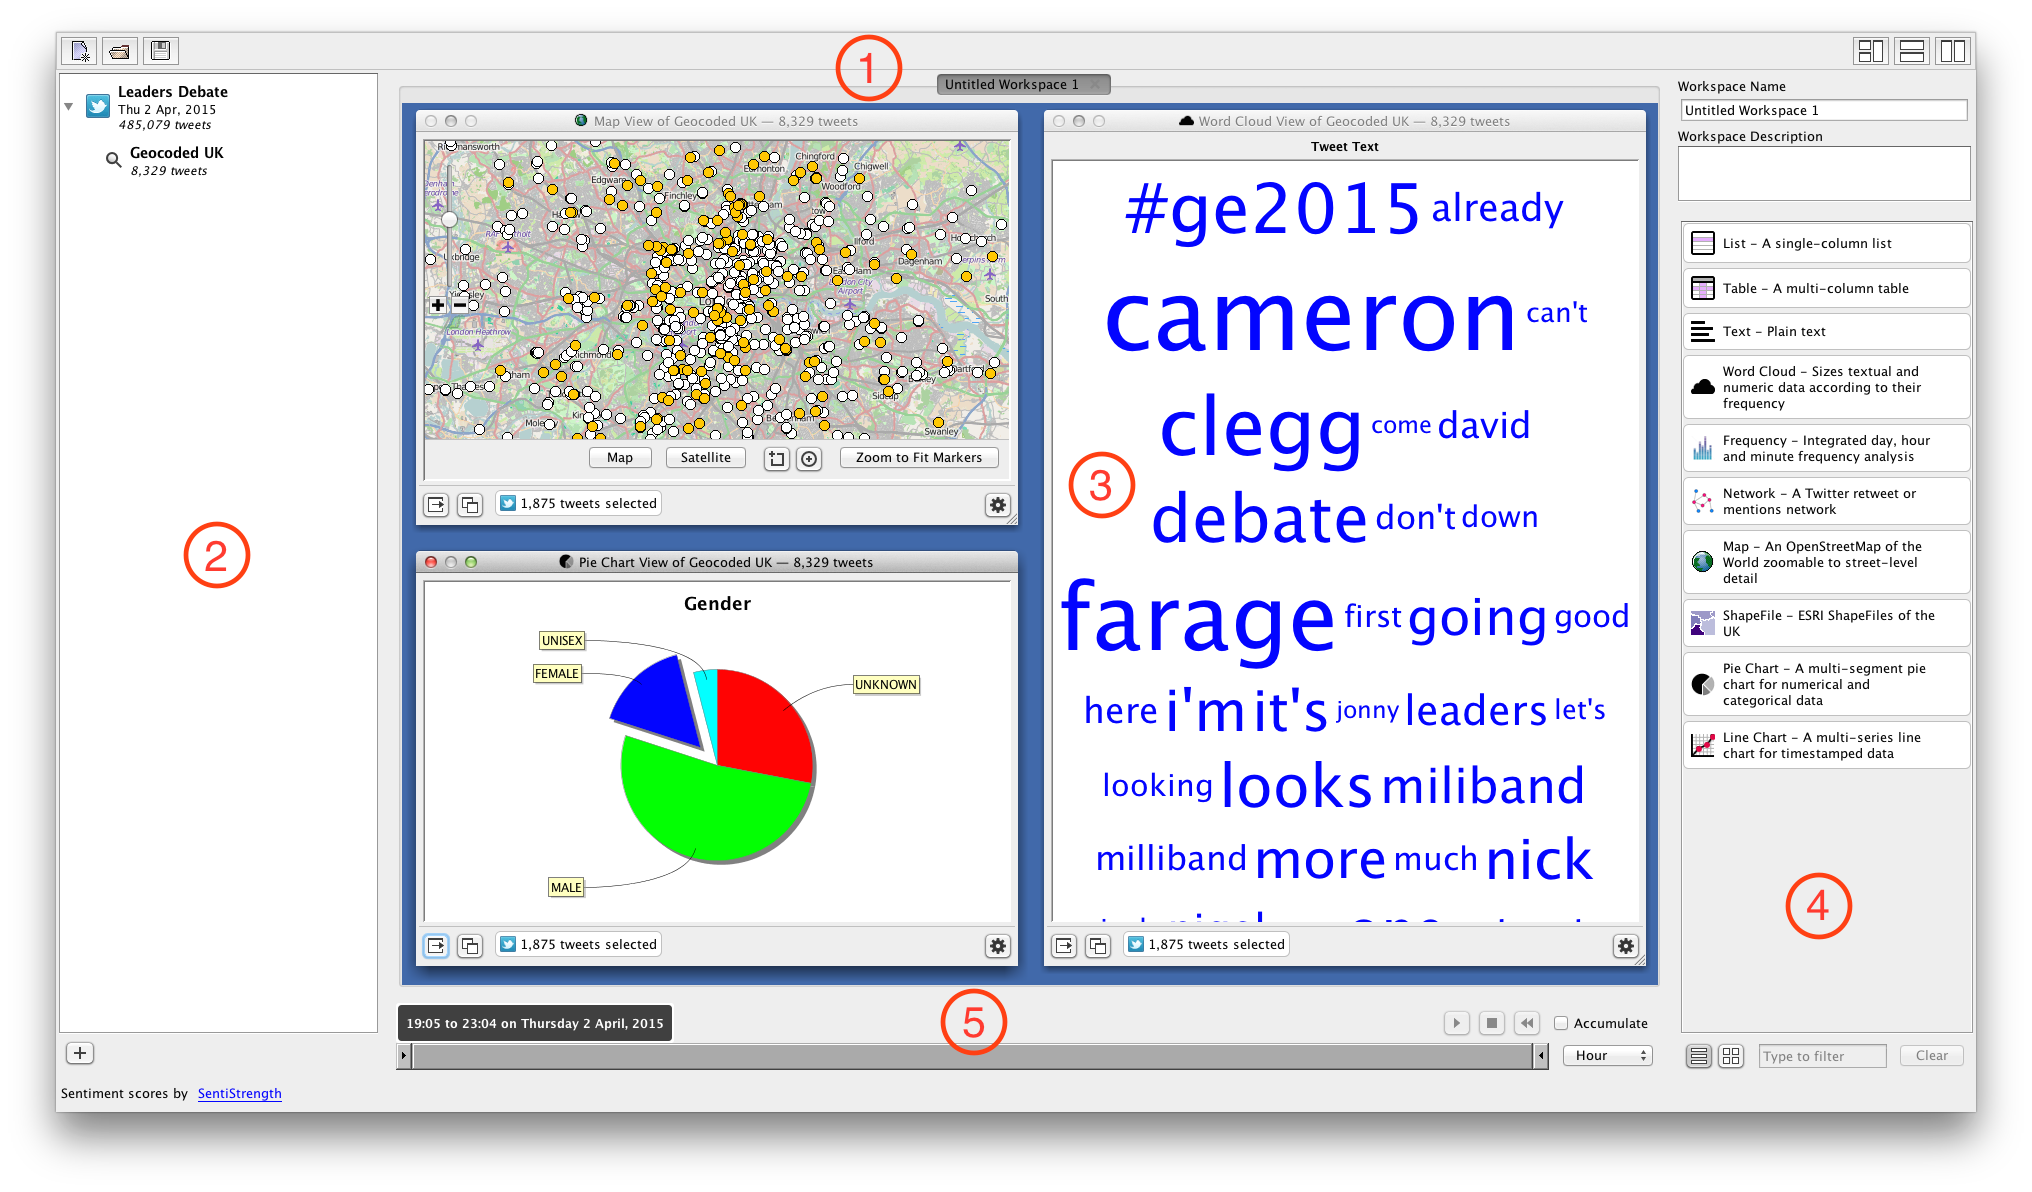
The COSMOS Desktop user interface has four areas:
- The toolbar contains commonly used tools
- The data set library provides access to data sources, queries and selections
- The workspace is where users drag and drop data and visualizations
- The visualization library lists the available visualization styles
- The time range filter enables users to scrub through data by hours, minutes and seconds
Building Visualizations
COSMOS Desktop enables users to build visualizations by dragging and dropping data and visualization components onto a workspace. COSMOS Desktop provides multiple-coordinated views of the data, which means that when users select data in one visualization, the corresponding data in the other visualizations in the workspace is also highlighted. The following video shows how to build a multiple-coordinated visualization with COSMOS Desktop.
Drilling Down into Data
COMSOS Desktop enables users to drill down into data by querying and iteratively refining data selections, as show in the following video.
Adding Data Sources
COSMOS Desktop currently enables users to visualize and interrogate data from three sources:
- Twitter data
- CSV files
- RSS feeds
Importing Pre-Existing Twitter Data
COSMOS Desktop enables users to import pre-existing Twitter data collections in JSON format, including the original Twitter format returned by the Twitter streaming API and the GNIP Activity Stream format in which collections bought from Twitter are marked up.
To import Twitter data, simply open the Import Twitter Data dialog and drag and drop files and folders containing the compressed or uncompressed data, as shown in the following video. The progress bar at the bottom of the dialog provides feedback on the task of importing all the files. Feedback on the progress of importing individual files is provided by a spinning icon that is replaced by a green tick after each file is imported. After import, each data source is added to the Data Set Library in the left hand panel.
Twitter data imported into COSMOS Desktop is stored locally on the user’s computer in an SQLite relational database, which performs well for collections of up to ten million tweets.
Collecting and Importing Twitter Data
COSMOS Desktop also enables users to collect Twitter data from the one percent streaming API. Users can control whether the collection is a random sample of the one percent Twitter stream or whether it should be filtered by keywords, hashtags and user accounts.
During collection, COSMOS Desktop provides feedback on the size of the collection and when enough data has been collected, users can import the data. COSMOS Desktop enables users to collect Twitter data without programming but does require users to authenticate COSMOS Desktop with their Twitter username and password. Watch the following video to see how easy it is to collect and import custom Twitter collections.
Adding CSV Files
Adding CSV files to COSMOS Desktop enables users to visualize and interrogate any data that can be marked up in CSV format. To add a CSV file to the Data Set Library, simply drag and drop a CSV file on to the Data Set Library panel or select the Add CSV File option, as shown in the following video.
Adding RSS Feeds
Adding RSS feeds to COSMOS Desktop enables users to visualize and interrogate syndicated web data. To add an RSS feed, simply copy and paste or drag and drop the the URL of the feed into the Data Set Library, as shown in the following video.
Data Views
COSMOS Desktop enables users to drag and drop ten data views onto the workspace:
- Table
- List
- Text
- Word Cloud
- Frequency Analysis
- Network Analysis
- Map
- Shapefile
- Pie Chart
- Line Chart
Each data view is presented in a movable, resizable frame that provides a standard set of controls for duplicating the data view, exporting data and images, and revealing the settings panel for the data view.
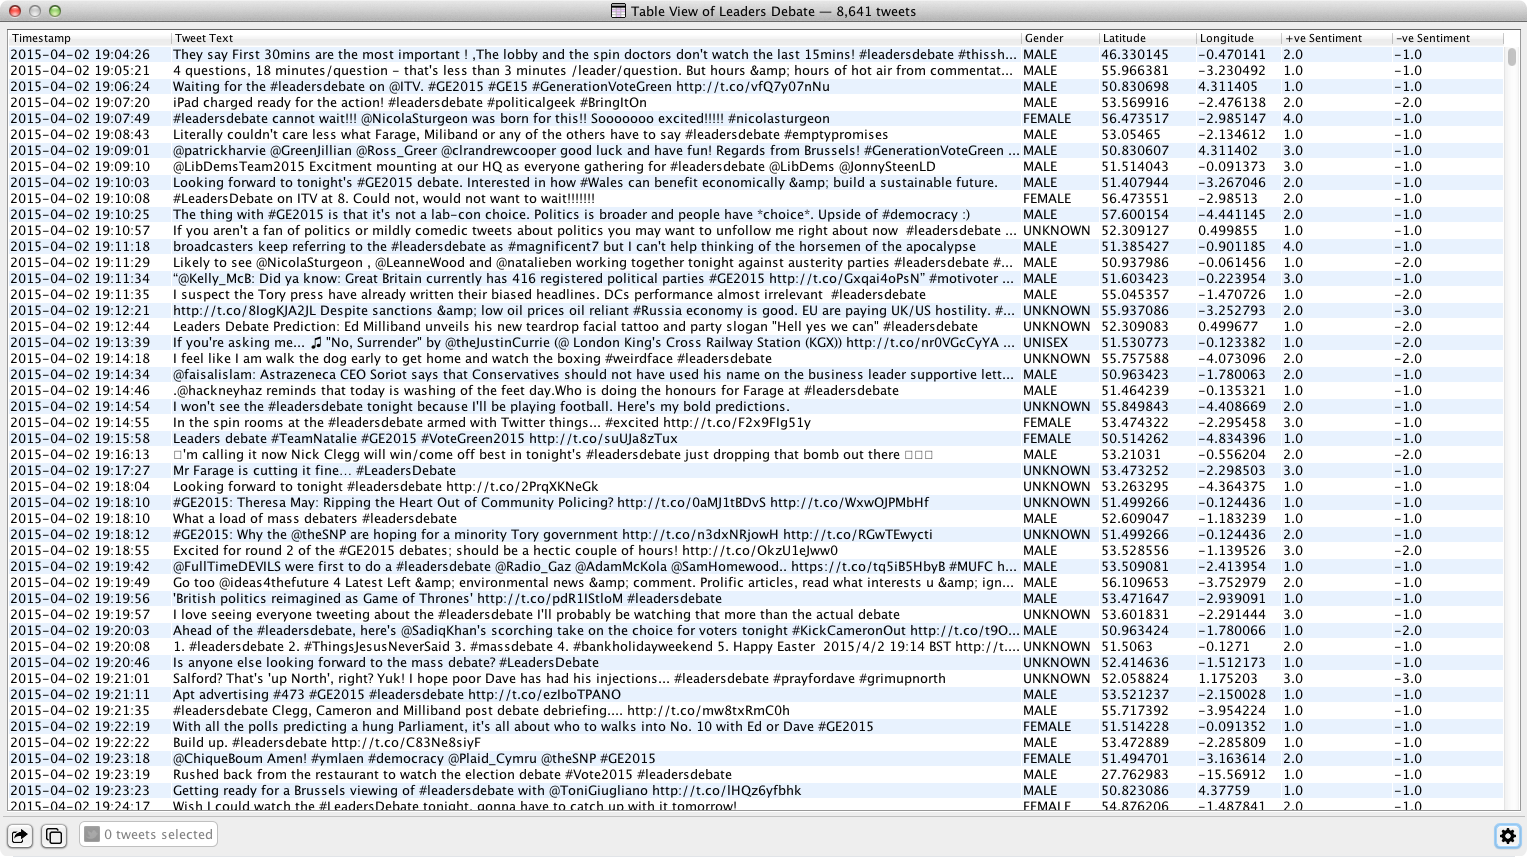
Table and List Data Views
The Table data view is the default view for all data sources dragged onto the workspace. The values in each underlying data object are exposed as columns in the table, one row per data object. The List data view provides a simplified table view with one column.
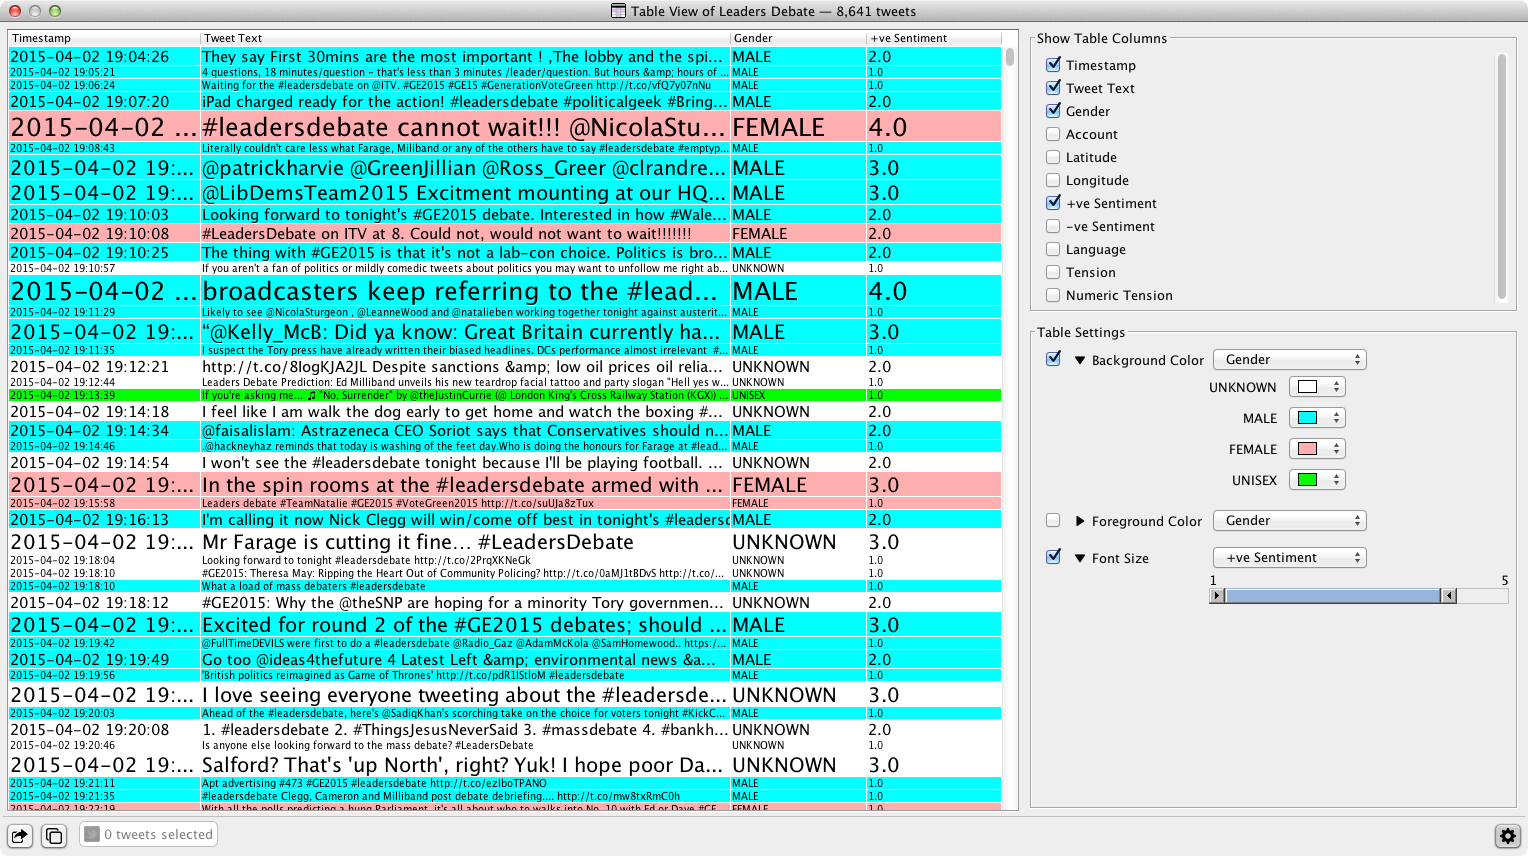
Using the controls on the right, users can bind the following visual characteristics to the data in the table:
- font size
- row foreground color
- row background color
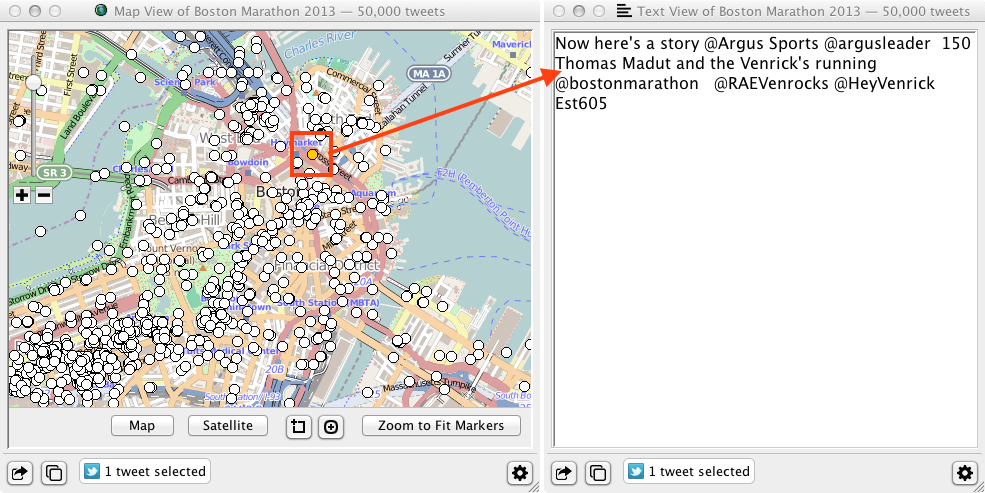
Text Data View
The Text data view provides a simple textual view of the values of one data column, which is user selectable. The Text data view is used in a supporting role to provide extra information when drilling down into data. The following screenshot illustrates the link between a Text data view and a Map data view via the multiple-coordinated visualization system; clicking a map marker that represents a geocoded tweet displays the text of the tweet in the Text data view.
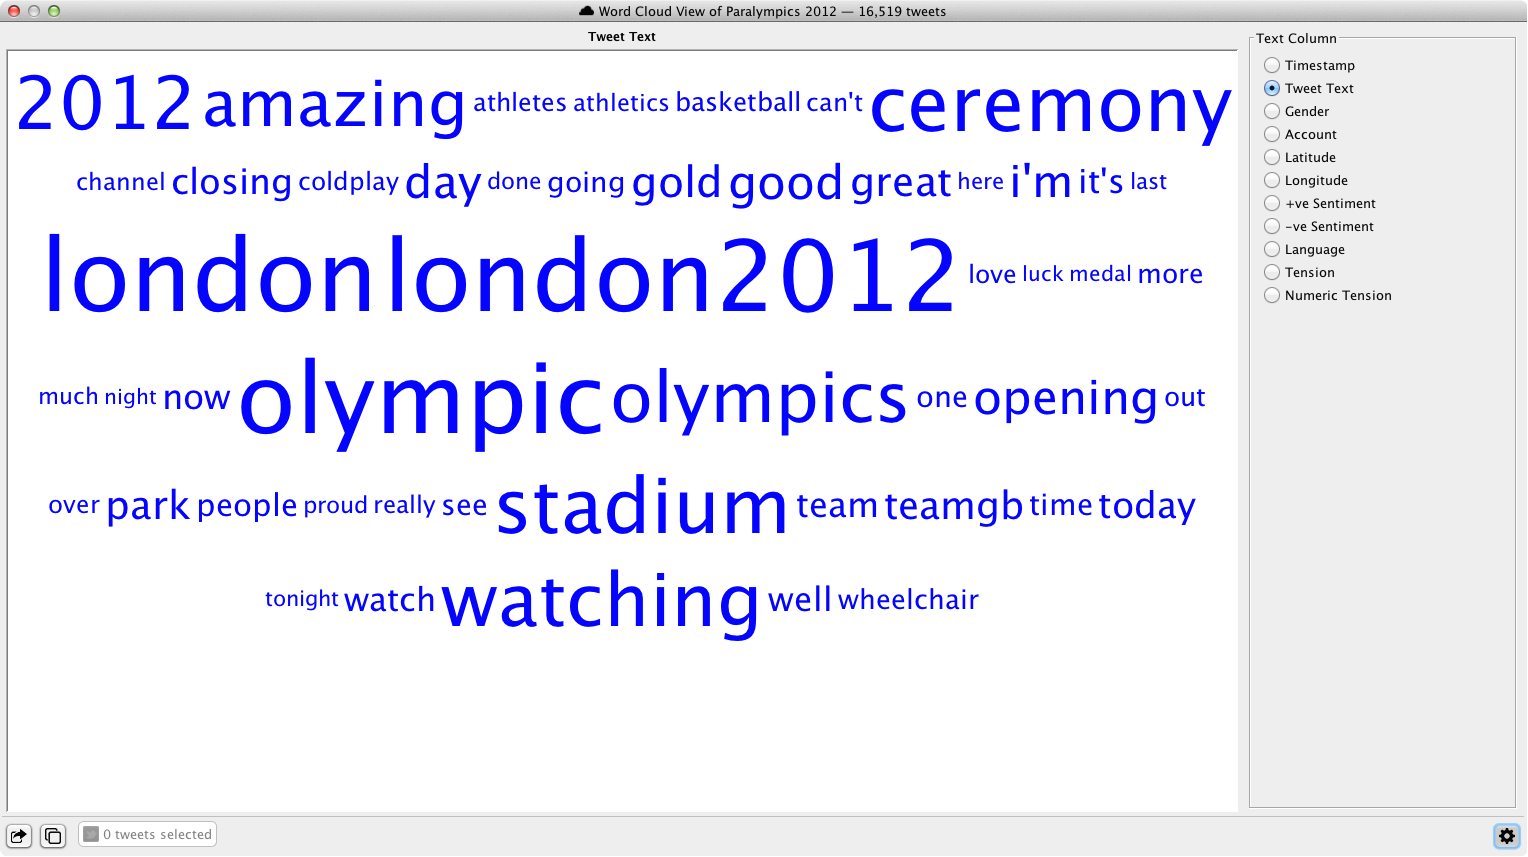
Word Cloud Data View
The Word Cloud data view sizes the words in a text column based on their frequency across all the rows in the table. Users can shift-click words to remove them from the cloud, which is useful for words that occur so frequently they dominate the cloud. The following video shows how to select the data column that populates the word cloud and how to remove words that dominate the cloud. The word frequency data used to build the word cloud is exportable in CSV and Excel format.
Frequency Analysis Data View
The Frequency Analysis data view provides frequency views at three levels of temporal granularity:
- The day frequency chart shows the number of data objects produced per day
- The hour frequency chart shows the number of data objects produced per hour
- The minute frequency chart shows the number of data objects produced per minute
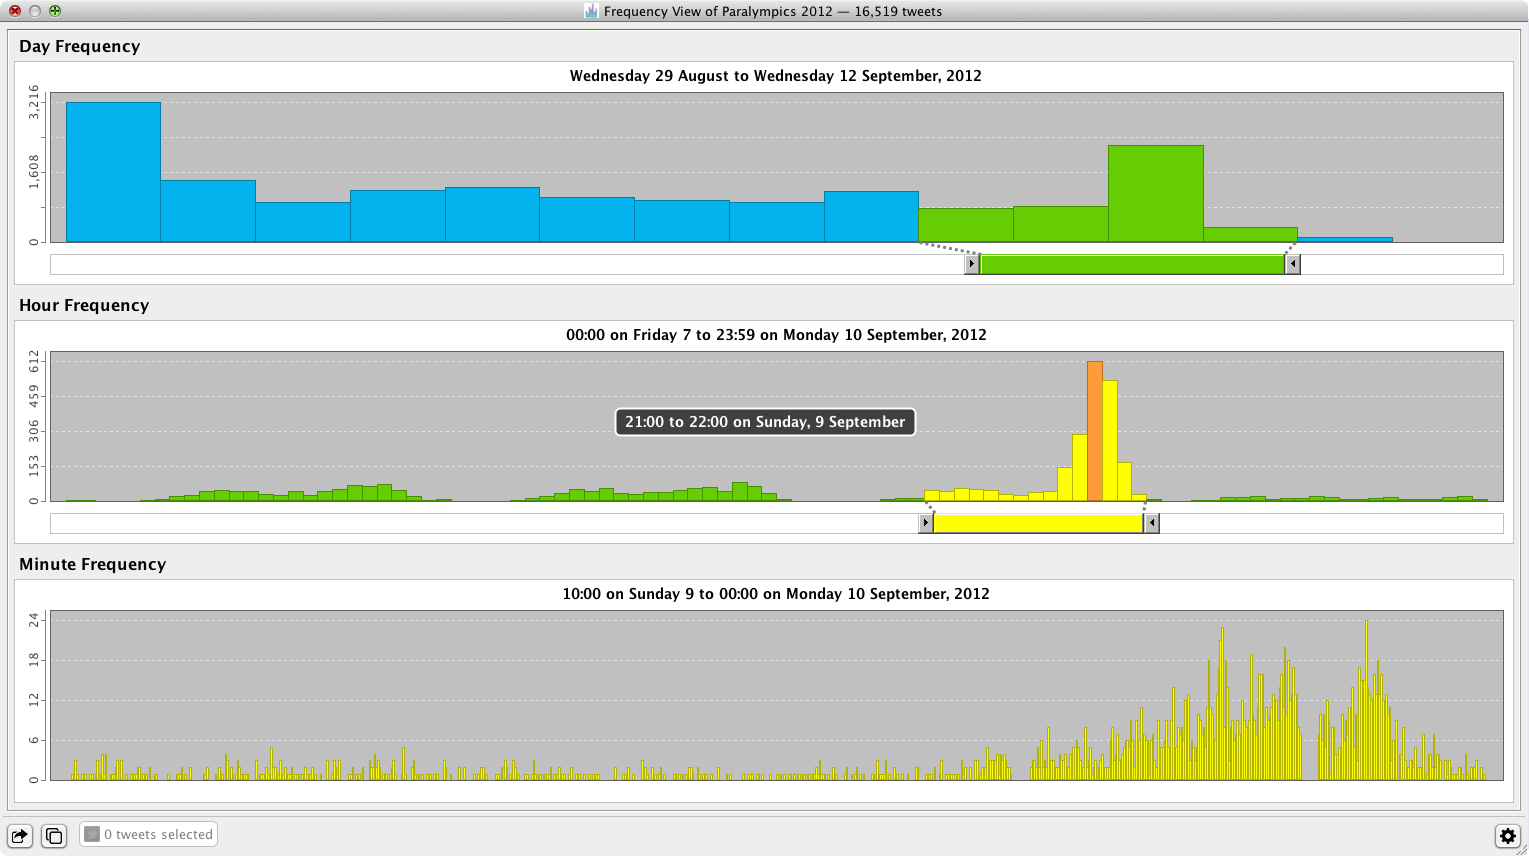
Moving the mouse over the bars enables users to scrub details on the exact day, hour or minute represented by the current bar.
The day, hour and minute frequency charts are connected by the double-ended sliders below each chart. The green slider below the day frequency chart selects a day range that controls the data displayed in the hour frequency chart. The hour frequency chart displays the number of data objects produced per hour within the day range selected by the day frequency slider. Similarly, the yellow slider below the hour frequency chart selects an hour range that controls the data displayed in the minute frequency chart. The minute frequency chart displays the number of data objects produced per minute within the hour range selected by the hour frequency chart.
The following video shows the interaction between the charts in the frequency data view.
The data used to build the three frequency charts is exportable in CSV and Excel format. Exporting the data enables further manipulation and visualization of the data in other applications such as spreadsheets.
Network Analysis Data View
The Network Analysis data view provides a social network graph based on retweets or mentions.
The network graph is built automatically using a force-directed layout algorithm without requiring users to input configuration parameters or other settings. This approach to user interface design enables users to work with the network immediately, which is contrast to tools such as Gephi that require considerable knowledge and user input to produce a network graph.
The size of the nodes represents one of three user-selectable network metrics:
Nodes are filtered with a slider that removes nodes with a metric value greater than the slider value. Nodes that have been filtered out and the edges that connect them are displayed in two user-selectable styles:
- Dimmed
- Filtered out nodes and edges are drawn semi-transparently to maintain their context in the network
- Hidden
- Filtered out nodes and edges are not drawn to provide a clean view of the remaining nodes and edges
Node labels are filtered with a slider that hides the labels of nodes with a metric value greater than the slider value.
The data used to build the social network graph is exportable in GEXF, GraphML and JSON format. Exporting the network graph data enables further manipulation and visualization in applications such as Gephi or libraries such as D3.
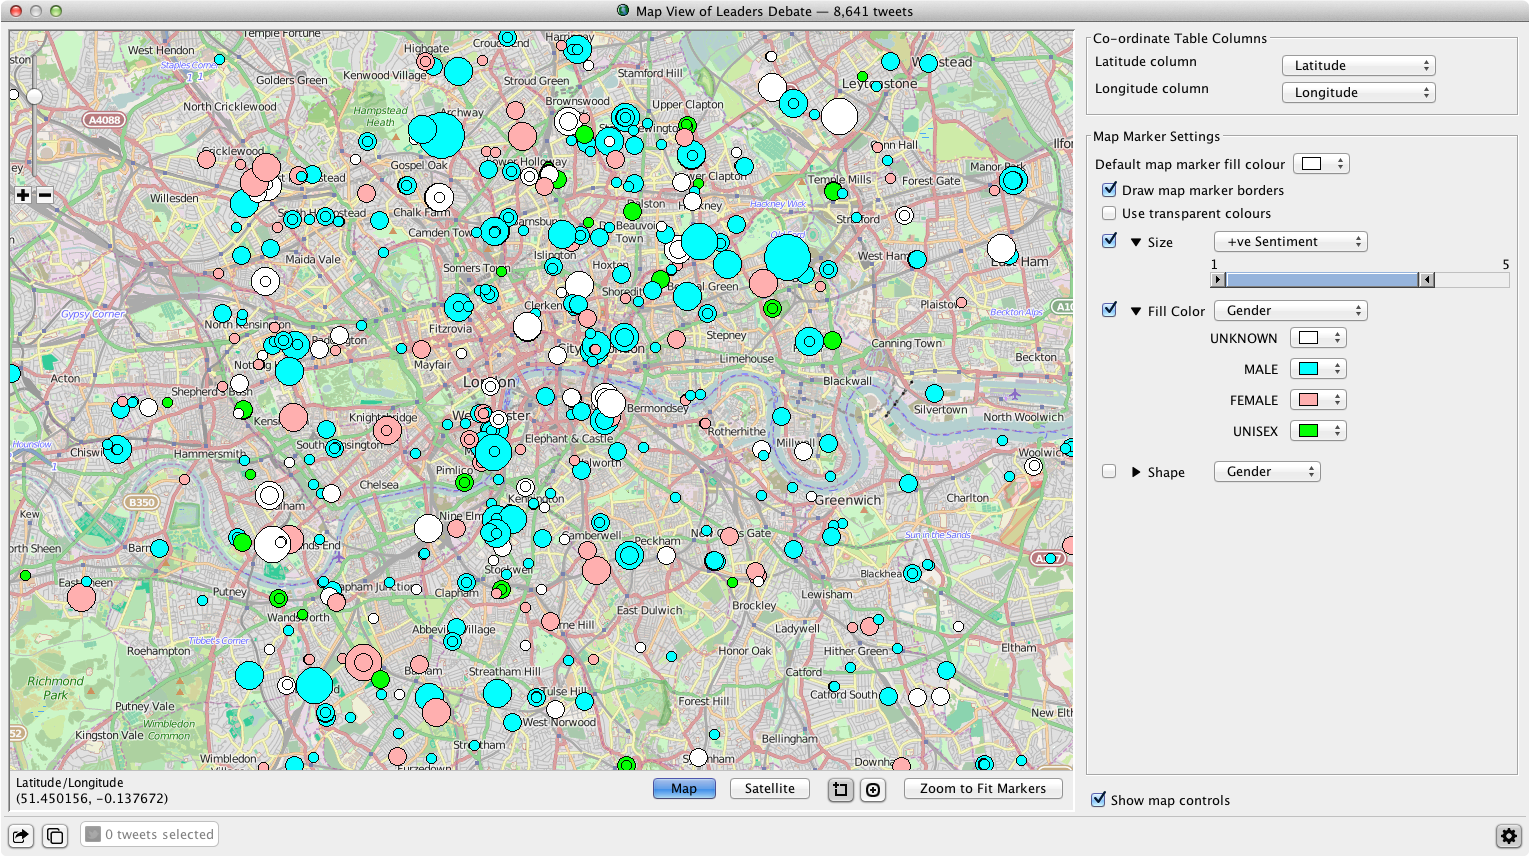
Map Data View
The map data view plots geocoded data as markers on an OpenStreetMap using the JMapViewer Swing component. Both map and terrain views are user selectable.
To provide a useful first view of the data, the Map data view automatically identifies and selects data columns that contain latitude and longitude data. The latitude and longitude data used to plot the map markers is exportable in KML format to enable users to continue interrogating their data in Google Earth.
Using the controls on the right, users can bind the following visual characteristics to the data:
- marker size
- marker color
- marker shape
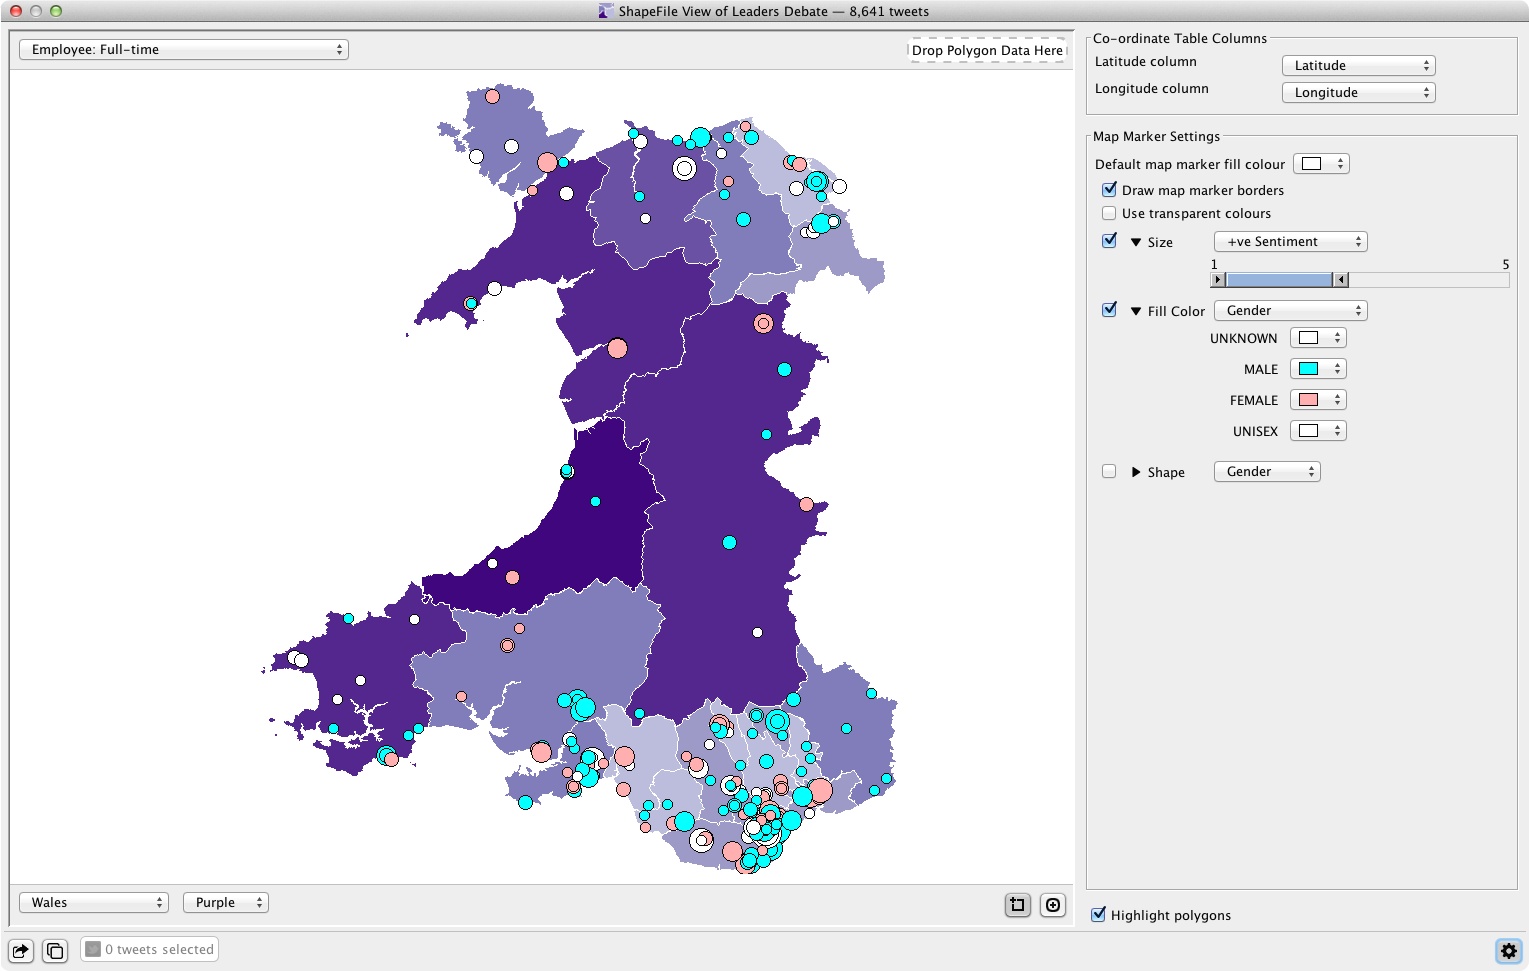
Shapefile Data View
The shapefile data view plots geocoded data as markers on shapefiles of the UK and its constituent territories: England, Wales, Scotland, Northern Ireland and the London boroughs.
To provide a useful first view of the data, the Shapefile data view automatically identifies and selects data columns that contain latitude and longitude data. The latitude and longitude data used to plot the map markers is exportable in KML format to enable users to continue interrogating their data in Google Earth.
Using the controls on the right, users can bind the following visual characteristics to the data:
- marker size
- marker color
- marker shape
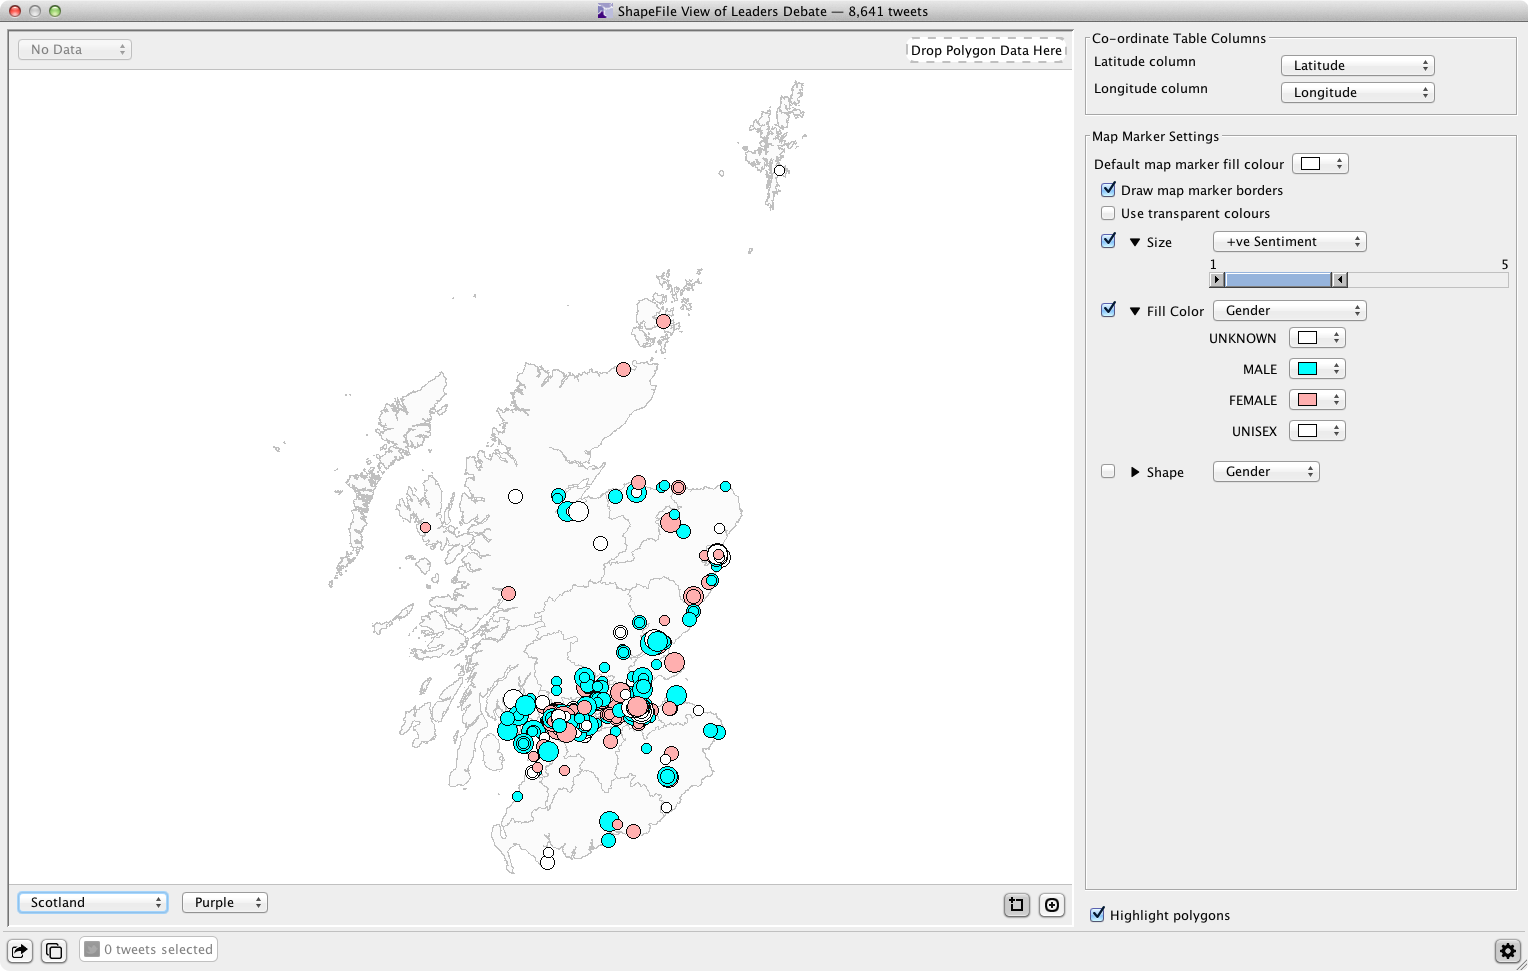
Users can also drag and drop a secondary data source onto the Shapefile data view to provide data for shading the polygons to produce a choropleth. The following screenshot shows the polygons in the Wales shapefile shaded with employment data from the 2011 UK census.
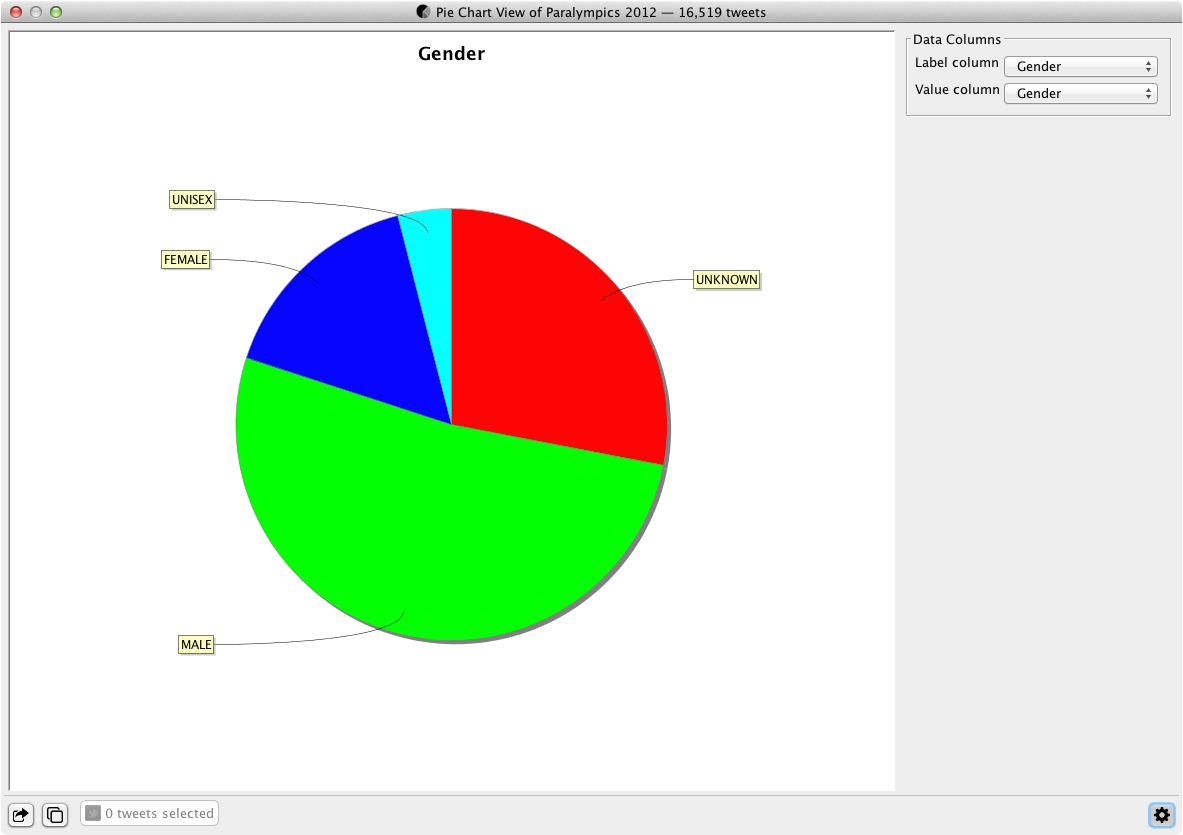
Pie Chart Data View
The Pie Chart data view segments the data in two columns: one column provides the data that sizes the angles of each segment; the other column provides the labels for the segments. To provide a useful first view of the data, the Pie Chart data view looks for categorical data columns to use for the segment values and labels. Users can change these columns to further explore the data using the controls on the right. The data used to produce the pie chart is exportable in CSV and Excel format.
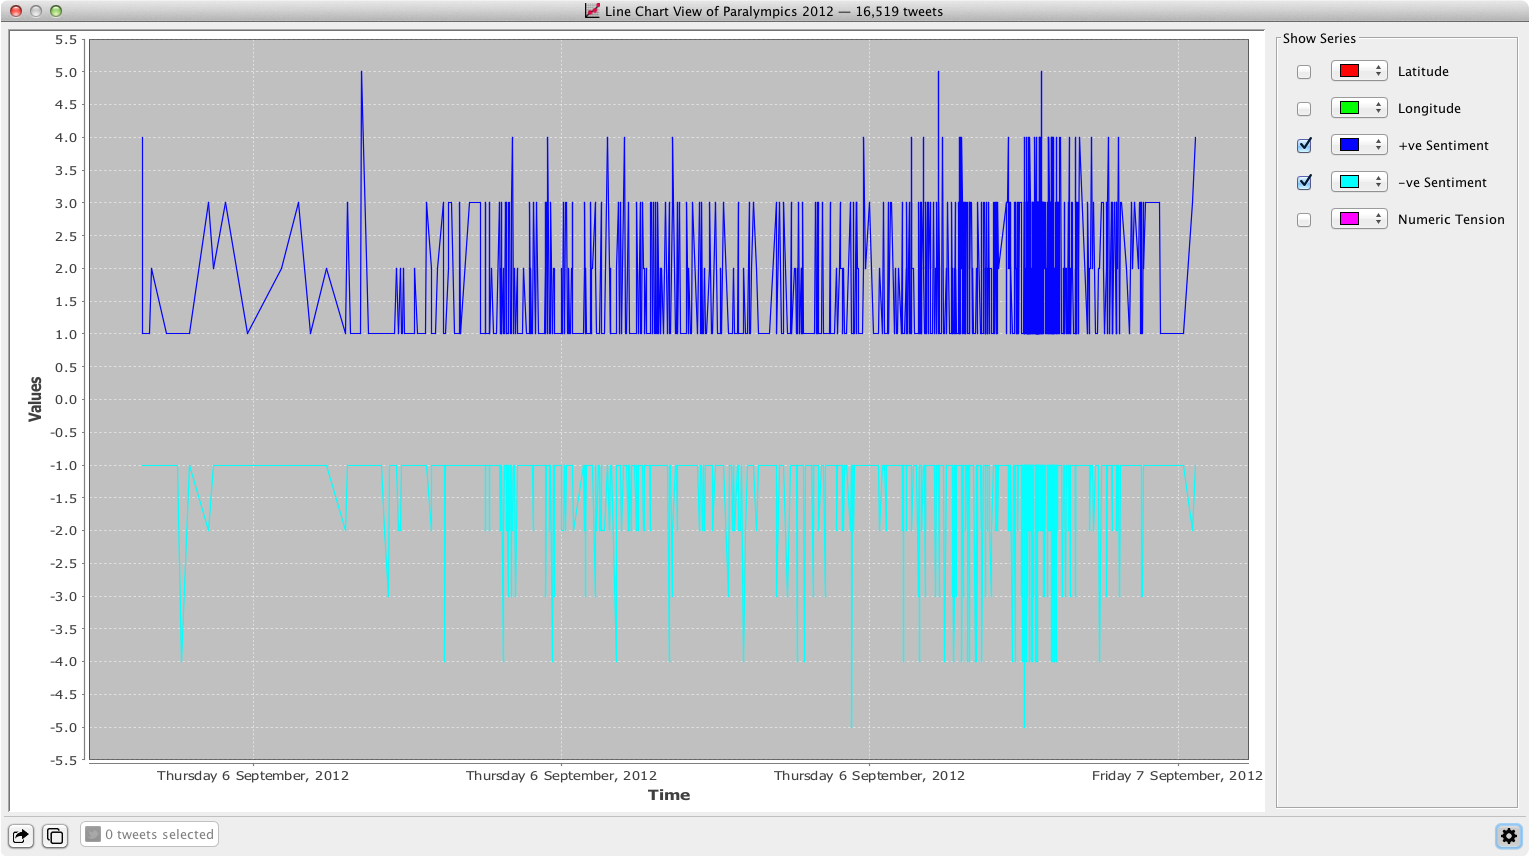
Line Chart Data View
The Line Chart data view plots the values in the numeric data columns against the timestamps in another column. Users can display or hide the lines that plot data column values using the controls on the right. The data used to produce the line chart is exportable in CSV and Excel format.
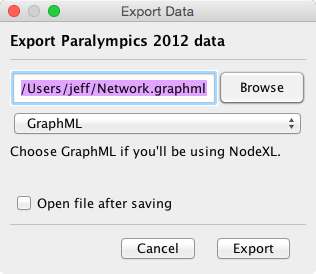
Exporting Data and Images
Exporting data is an important feature of COSMOS Desktop that enable users to further process their data with tools such as spreadsheets, statistical packages and network visualization tools.
Most visualizations can export data in both CSV and Excel file formats. Other visualizations provide export formats appropriate to their visual presentation. For example, the map visuaslition provides KML output of geocoded data for import into Google Earth whereas the network analysis visualization provides export in three network graph formats for import into tools such as Gephi or NodeXL.
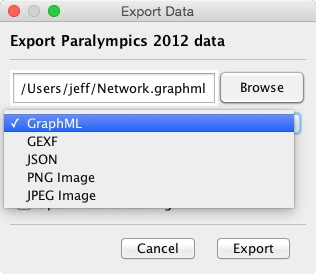
In addition to exporting data, exporting images enables users to include their work with COSMOS Desktop in presentations, academic papers and on the web. COSMOS Desktop provides a consistent exporting framework that enables all visualizations to export images in both PNG and JPEG formats.