
Detecting Anomalies with Human Sensors
Sentiment analysis is a text analysis technique that measures the number of positive and negative ideas and expressions in a piece of text.
The following chart shows a plot of the sentiment scores for a set of tweets collected using the keywords tottenham and hostage and the hashtags #tcr and #mayhem between 09:04 and 13:05 on April 27, 2012. The sentiment scores are plotted against time.
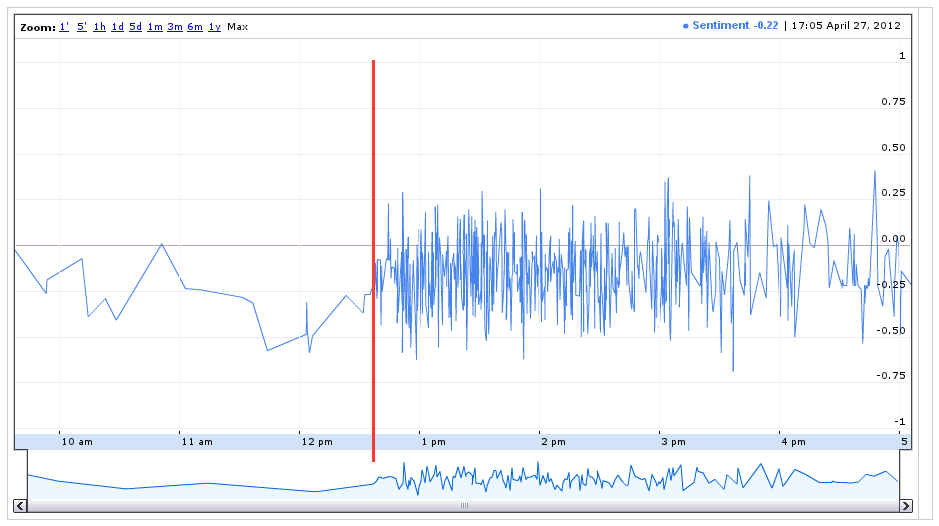
This set of tweets captures the unfolding action of an event in the Tottenham Court Road area of London, UK, in which a man, according to varying reports from eye witnesses and on Twitter, was holding people hostage in an office block and threatening to detonate a bomb.
On average the sentiment is negative, as one would expect for a fraught and potentially life-threatening situation. However, the value of this plot of sentiment against time is the rapid increase in frequency of the number of tweets at approximately 12.35, the tipping point when the event began to be discussed widely in the Twittersphere.
This chart shows Twitter users acting as human sensors of their environment. By applying anomaly detection algorithms to Twitter data—in this case frequency data—we may be able to develop warning systems for social unrest.