
Visualizing Web Cache Resources with 3D Virtual Worlds
VORTICES is a novel visual resource discovery tool that enables users to create 3D visualizations of web cache data. Users query a cache resource database with an HTML query form and the results are visualized in two new visualizations styles. The cities visualization presents cache resources as groups of skyscraper blocks floating in a virtual world. The cactals visualization represents cache resources as groups of tree structures. Queries and visualizations are also cached and made available to users. VORTICES has a four-tier architecture that marks up in SGML the data in a Squid cache and stores it in a Zebra Z39.50 database, and generates VRML visualizations of query results.
1. Introduction
VORTICES (Visualization Of Resource Traits In CachES) is a novel visual resource discovery tool for exploring cached Internet information spaces. VORTICES supports the discovery of relevant resources by enabling users to create 3D virtual environments that depict selected traits of web proxy cache data in two new visual presentations. Users browse these visualizations looking for resources of interest by studying the salient features and contrasts of the visual presentations and fetching the details of interesting resources. The mappings between data and the visual presentations are highly configurable to enable users to tune them to best serve their needs as information seekers.
VORTICES builds on experience gained during previous work on developing agents to support resource discovery (Kirby et al. 1995) and aims to reinforce that work by developing a complementary resource discovery tool.
Section 2 describes the background to the VORTICES project and the previous work that it builds on. Section 3 describes how users explore cache data with VORTICES. Section 4 describes cities and cactals, the two novel visualization styles that were developed to present cache data. Section 5 discusses two of the social considerations of a shared resource discovery tool: censorship of cache data and user privacy. Finally, section 6 describes the four-tier architecture of the VORTICES software.
2. Background
The Internet is characterized by enormous data volume, rapid growth in the user base, and burgeoning data diversity (Bowman et at. 1994a). To make use of this wealth of evolving, diversifying information, which is not well organized and is often fragmentary, users need effective support to access information of interest. Resource discovery systems address this need by identifying resources, collecting information about them from multiple sources, and converting those representations into formats suitable for efficient searching. Users commonly interact with existing resource discovery systems such as Archie, Harvest (Bowman et al. 1994b), Lycos, Netfind, and WAIS by searching or browsing. When searching, the user provides some description of the resources being sought and the discovery system locates information that matches that description. When browsing, the exploration of the organization and contents of networked information spaces is steered by a continual process of the user reacting to samples of the resources that are discovered.
Searching is more flexible and general than browsing but is harder for the user. Forming good queries is difficult especially in unfamiliar information spaces. The poor structure of the underlying repositories of Internet information often make searches imprecise. Practical use of search facilities often requires progressive refinement of queries in the reactive manner of browsing. Browsing gives the user more control of resource discovery than searching enabling the user to use continual feedback from exploration to guide further exploration for more information. Browsing is usually more difficult because of the sheer scale of information to survey, the time a browser takes to fetch successive resources, and the lack of support users are given to rapidly identify relevant content in fetched resources.
Users of resource discovery tools need ways to use searching facilities that make browsing more effective. In particular, they need support to reduce the amount of potentially relevant information they need to browse, to speed up perusal of successive items of information, and to enhance the rapid discrimination of relevant information content.
Caching facilities for Internet information retrieval (Bowman et al. 1994b, Luotonen & Altis 1994) store information that is currently in demand, which is a good indicator of relevance especially when users with similar interests use the same cache. Thus Internet caches provide good substitutes of manageable size for the parts of the vast Internet information space of relevance to users. Internet caches also tend to store the information resources they manage in a uniform way in one place. This enables the information to be indexed on a wide variety of its characteristics facilitating rapid traversal from one stored item to the next. These traits make caches suitable for servicing fast and highly functional cache browsing facilities.
Textual resources stored in Internet caches are hard to survey rapidly as text. Although surrogates such as short summaries and keywords are more easily grasped, they are not easy to survey rapidly either. For rapid browsing to become feasible, the characteristics of Internet resources needs to be translated into a form in which they can be quickly grasped and contrasted with related information.
Mapping characteristics of data into visual presentations in virtual environments is one promising way to make rapid discrimination of relevant content possible. Keyword queries of cached resources could be answered by graphic presentations that visualize the selectivity of the query over the space of cached resources. The dimensions of the space might represent selected resource traits such as size, access frequency, type of source, date of origin, age in cache, access method, MIME type, and so on. Users could then see how the selectivity is refined in terms of these traits by seeing dynamic changes to the size, shape, colour, or connectivity of graphic presentations as the user changes the keywords in the query.
Resources might also be mapped to points in a space that clusters them by the degree to which resources share keywords. Clusters would then pick out active areas of interest in a site. The virtual environment setting would enable interested parties to zoom in on a dense cluster and perhaps turn on the visual presentation of other traits such as access frequency by colour to pick out the most promising item in this cluster for closer inspection.
Many mappings of resource characteristics to visual presentations are possible and it is not to be expected that all users will find the same visual metaphors equally useful. Thus effective use of such a visual tool will require that the choice of which presentation style to use, and the mappings between data and the elements of a presentation style, are able to be configured by the user.
Work by Shneiderman (1993) and Ahlberg & Shneiderman (1994) has shown the dramatic effectiveness of comprehensive visualizations of complex data spaces combined with rapid feedback to modifications in the selection parameters in allowing users rapidly to home in on areas of direct relevance. Shneiderman has developed a range of visualization techniques including starfield diagrams and tree maps, which offer great potential in the domain of Internet resources. Other work by Zizi & Beaudouin-Lafon (1994), targeted ultimately at the Internet resource domain but tested so far only on static local information repositories, has explored geographic maps as a metaphor for display, representing semantic distance by physical distance between document clusters represented as towns on the map.
Earlier work at Heriot-Watt university on the ELF (Sykes et al. 1994) and IDIOMS (Taylor et al. 1995) projects established the value of supporting resource discovery at a site by integrating the services of a driver to search for resources of interest to users at the site with a cache to speed up their access to frequently accessed resources. It also established the limitations of using automated methods to aid resource discovery. Extracting suitable keywords to supply to the ELF system by monitoring a user’s computer based activities proved useful to seed information searches for users but cannot match the discrimination given to search by having a user in the driving seat of a resource discovery engine. VORTICES aims to complement the agents and facilities developed under the ELF and IDIOMS projects with a tool that supports active browsing with real-time dynamic feedback.
3. Exploring Cache Data with VORTICES
Users explore cached web resources by visiting a VORTICES web site and either specify resources for compilation into a visualization by querying, or select a precompiled visualization. Users then load the selected visualization and can visually browse through characteristics of selected resources. Full details of the resources of special interest or even the resource itself can be fetched on demand.
Queries and visualizations compiled by previous users are cached and shared with other uses which increases the value of VORTICES as a shared resource discovery tool. New queries exercise a VORTICES web server that can compile visualizations of cached web resources in two different styles. The cities visualization represents resources by skyscraper blocks grouped in regions and levels in space. The cactals visualization represents resources as the arms of prism trees on a plane of grid meshes. The server extracts its data by querying a Zebra database that stores details on web resources cached in a Squid proxy cache. The Zebra database is updated overnight from Squid cache log entries.
A VORTICES server enables users to query the information in a proxy cache using a wide variety of characteristics:
- first level domain
- top two domains
- hostless domain
- access method
- content type
- major content type
- minor content type
- age and size of the resource
- the users that have accessed the resource
- number of references (the number of times the resource has been accessed)
Users query the VORTICES database with the following HTML form interface. As far as possible, the user is presented with all of the available values for each attribute that can be queried. For example, the content type list enables the user to select all of the content types that are currently in the database. Presenting the values that are stored in the database makes querying easier for the user because they do not have to think of values to enter, they simply select them from a list. The query form teaches the user about the structure and contents of the database and avoids a range of syntactic and semantic input errors.
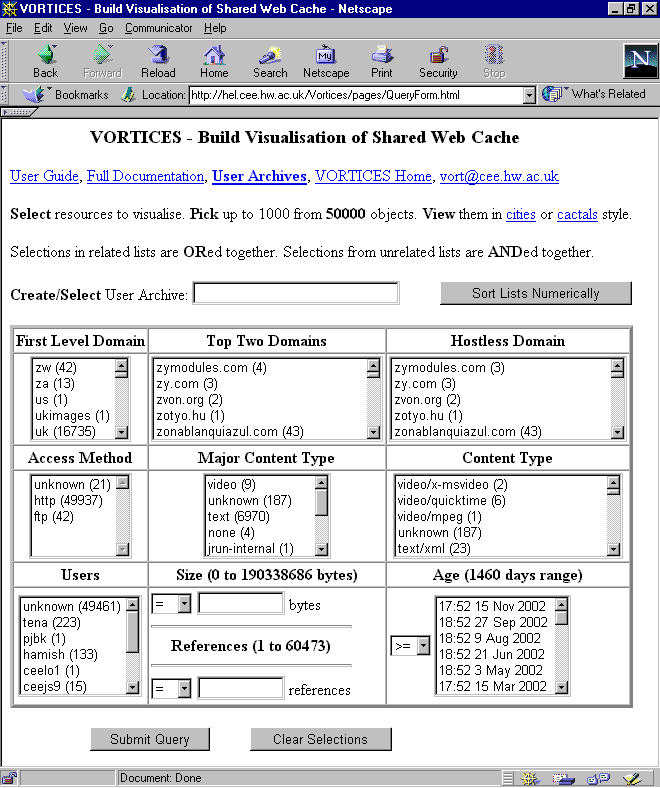
The two text input boxes collect numeric values for the size of a resource and the number of times a resource has been requested. Ideally, these input values would be displayed and constrained between the minimum and maximum values by a numeric slider but HTML forms do not provide such a widget. However, the numeric values are validated by a Javascript routine that is called when the query form is submitted. If the values are out of range, the user is informed and the query is not submitted; only valid queries will be submitted.
The next section describes cities and cactals, the two novel visualization styles developed to present the results of querying a VORTICES server.
4. Visualization of Query Results
Two novel 3D visualization styles were developed to present cache resources that answer user queries. The cities visualization represents resources by skyscraper blocks grouped in regions and levels in space. The cactals visualization represents resources as the arms of prism trees on a plane of grid meshes. Both of these visualization styles and the ways in which users can interact with them are now described.
4.1 Cities Visualization
The cities visualization is designed to support visual information seeking with Shneiderman’s (1996) model of overview first, followed by zooming and filtering, and then requesting details on demand. Cache resources are presented as groups of skyscraper blocks floating in a virtual world.
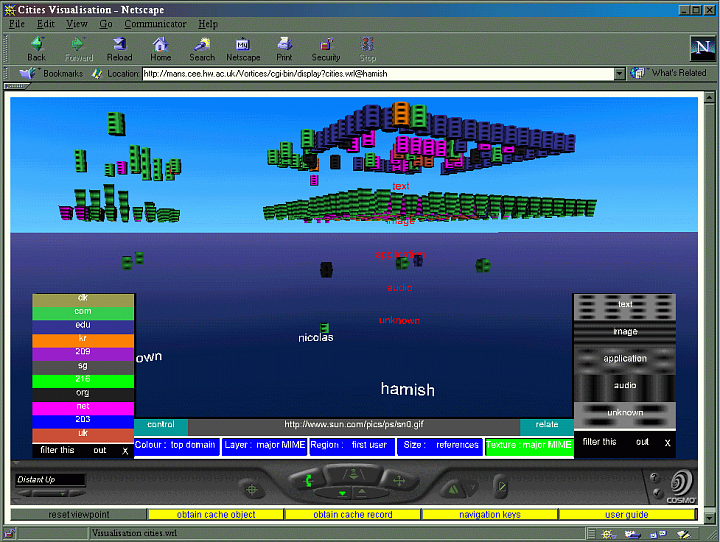
Each block represents a distinct resource which can be related to others by shared traits (using colour, shape, size, and texture) and spatial groupings (using regions and layers). These visual attributes represent properties of cached resources such as:
- the access method that fetched it
- the date when it was cached
- the domain name of its source
- the resource’s MIME type
- the resource’s size
- the user who first fetched it.
The user can interact with a cities visualization to:
- change which visual attribute portrays which resource attribute
- control labelling of visualized resources
- explore the visualization as a virtual environment
- filter out visualized resources by their attributes
- get full details of visualized resources
- list ranges of values of resource attributes
- obtain URLs of visualized resources.
The interactive controls enable users to browse the shared web resources in a visual way in the search for interesting content. Once interesting resources have been identified, a full description of the resource, or the resource itself, can be viewed in a second instance of the browser.
4.2 Cactals Visualization
The cactals visualization represents cache resources in tree structures, referred to as cactals (a cactus/fractal hybrid). Cache resources are grouped according to their properties. Grouping is implemented on two levels. Resources of a similar type are arranged as branches of a tree, and groups of trees are arranged on a planar grid. Each grid is positioned on a horizontal matrix that represents two further properties shared by its trees. The mapping between properties and grouping can be configured by users.
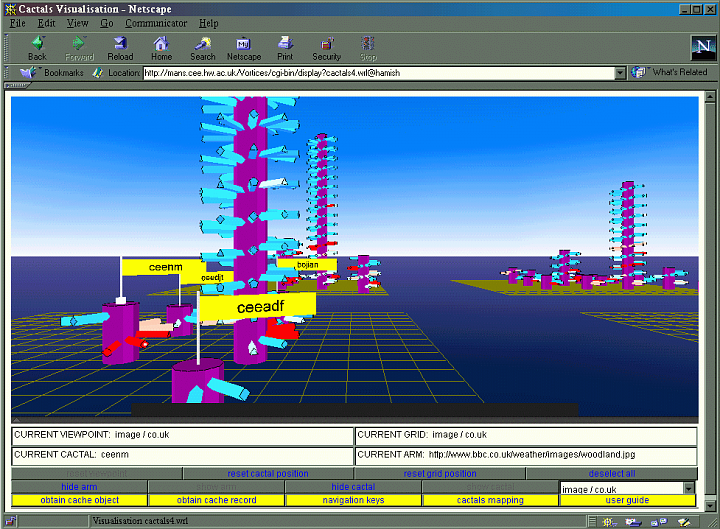
In a typical mapping, a tree may represent resources of a particular MIME type, say JPEG files, the x axis of the grid-matrix may represent individual users, and the z axis of the grid-matrix may represent sites from which resources have been accessed. Additional information about the properties of cached resources may be mapped to the cross section of each branch of a tree, the colour of each branch of a tree, and the length of each branch of a tree.
The user can interact with a cactals visualization to:
- move to one of a number of predefined viewpoints
- navigate through the visualization
- display the URL of visualized resources
- display the attribute represented by a tree
- display the attributes represented by a grid’s position in the grid-matrix
- select one or more branches
- display the current selected branch URL
- select one or more trees
- display the current selected tree type
- select one or more grids
- display the current selected grid attributes
Branches and trees can be selected by clicking anywhere on the branch or tree, respectively. A grid is selected by clicking on one of two grey cubes which are situated at the two front corners of each grid. Four operations can be performed on selected objects using the keyboard or applet controls:
- branches, trees and grids may be hidden/shown
- a full description of the resource represented by a branch may be displayed
- the resource represented by a branch may be displayed
- trees and grids may be translated and rotated in space.
The interactive controls enable users to navigate cache resources visually to search for particular content. Once interesting resources have been identified, full descriptions of each resource, or the resource itself, can be viewed in a second instance of the browser.
5. Social Considerations
VORTICES servers are shared resources that provide a query interface and visualizations of the material accessed by proxy cache users. Administrators need to consider whether certain material is appropriate to be stored and therefore queried and visualized, and whether users want to be identified and connected with the material they access. These issues of censorship and user privacy are now discussed.
5.1 Censoring Cache Data
The VORTICES configuration file contains a stopped_site field that can be used to prevent the accumulation of records of inappropriate or illegal material. While VORTICES administrators may not wish to act as censors, the main aim of a VORTICES service is to make it very easy to follow the choices other users make when browsing the web. Unfortunately, a minority of Internet users fail to observe norms of propriety and may violate national laws when fetching inappropriate material from the web. VORTICES administrators have to face the challenge that if they are not to aid and abet tasteless, improper, or even illegal access to Internet resources then they need to censor what is made visible by a VORTICES server.
Censoring what the VORTICES database records obviously does not stop access to it by web browsers; it only prevents such accesses being viewed at the query interface and during visual browsing.
5.2 User Privacy
VORTICES administrators may also wish to review whether they wish to let users know who is fetching what resources. We feel this is a valuable facility which can expedite the sharing of knowledge. We run our VORTICES service so that anyone can look at what other known users are fetching. Admittedly PC users remain anonymous due to the lack of support under Windows for the ident service, but it allows the web browsing expertise of some of our most well known web users to be shared by others. Local UNIX users can preserve their anonymity by using a web browser on our local PC service which is widely available or by temporarily opting out of our local proxy service.
However, if privacy is felt to be more important, then one of two measures can be adopted to anonymise web users’ web accesses. Either the Squid proxy server can be configured not to perform ident lookups, or a dummy user name such as “anonymous” can be stored in the name field of each resource record stored in the Zebra database.
6. Software Architecture
VORTICES has a four-tier software architecture comprising client, server, visualization, and database tiers.
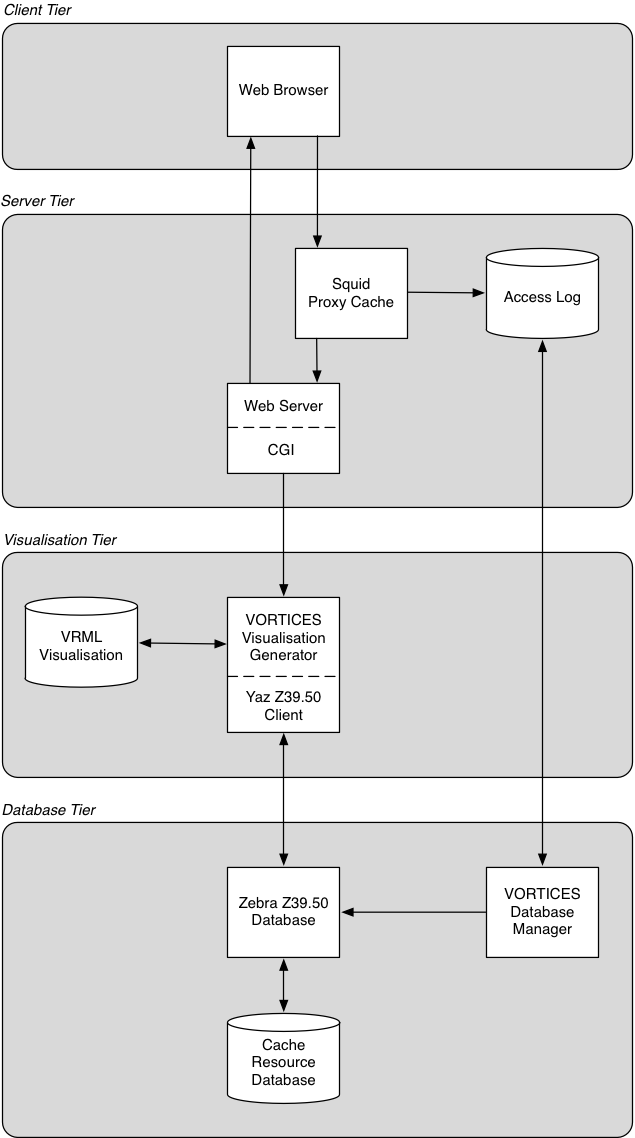
6.1 The Client Tier
The client tier consists of a web browser that presents the HTML query form. When a query has been constructed and the form is submitted, the query form values are sent to the server tier via HTTP.
6.2 The Server and Visualization Tiers
When clients submit a query at the VORTICES query interface, the form is processed by the server tier: a CGI script running on the web server. The CGI script connects to the VORTICES Visualization Generator with a socket and passes along the query form values. These values are used to generate a query for the Yaz Z39.50 client which then queries the Zebra database. The results, if any, are returned, and a VRML visualization is generated in either the cities or cactals style, as selected by the user at the query interface. The visualization is stored in a file on the server.
The response to the query form is an HTML page with a link to the visualization of the query results, or a report that there were no results to the query. A link to the visualization is provided rather than returning the visualization directly because VRML worlds can take some time to load and can occupy significant resources. If too many or too few results to the query are returned, the user may wish to reformulate the query and try again. The reformulation process would be hampered if the user had to wait for the VRML world to load before being able to make a new query.
6.3 The Database Tier
The database tier consists of a Zebra Z39.50 database and the VORTICES Database Manager. Every request made to the Squid cache for an Internet resource is logged in an access log file. A typical access log entry is:
883989695.673 819 pc137.cee.hw.ac.uk TCP_HIT/200 3259 GET http://dspace.dial.pipex.com/aaes/quest/orion/bauval.htm hamish NONE/wwwcache.cee.hw.ac.uk text/html
Periodically, the VORTICES Database Manager reads the access log file and updates the cache resource database. Each entry in the access log is parsed, marked up as an SGML record, and added to the Zebra database. The following is a typical cache log entry marked up in SGML.
<resource>
  <url> http://dspace.dial.pipex.com/quest/bauval.htm </url>
  <1st-level-domain> com </1st-level-domain>
  <top-two-domains> pipex.com </top-two-domains>
  <hostless-domain> dial.pipex.com </hostless-domain>
  <access-method> http </access-method>
  <resource-size> 3259 </resource-size>
  <first-logged> 883989695 </first-logged>
  <content-type> text/html </content-type>
  <major-content-type> text </major-content-type>
  <no-references> 1 </no-references>
  <reference>
    <reference-id> 1 </reference-id>
    <when> 883989695 </when>
    <duration> 819 </duration>
    <client-host> pc137.cee.hw.ac.uk </client-host>
    <cache-result> TCP_HIT </cache-result>
    <http-reply> 200 </http-reply>
    <http-request> GET </http-request>
    <user> hamish </user>
    <access-hierarchy> NONE </access-hierarchy>
    <source> wwwcache.cee.hw.ac.uk </source>
  <reference>
<resource>
The meaning of each SGML tag is shown below. There is one <reference> … </reference> block for each request.
<resource> |
Resource block |
<url> |
URL of cached resource |
<1st-level-domain> |
1st level domain of URL's server. For http://id.co.uk it's hk |
<top-two-domains> |
Server's top two domains. For http://bw.co.my it's co.my |
<hostless-domain> |
Server's local domain. For http://hq.mil.uk it's mil.uk |
<access-method> |
Access method of URL such as http, ftp, file, and news |
<resource-size> |
Size of resource in bytes |
<first-logged> |
Time when resource was first accessed in UNIX epoch seconds |
<content-type> |
MIME type of resource given by its server or inferred from suffix |
<major-content-type> |
Major content type of resource. Major content type of text/html and text/plain is text |
<no-references> |
Number of times resource has been requested |
<reference> |
Reference block |
The following table shows the meaning of the SGML tags that mark up each reference entry.
<reference-id> |
Number of reference to resource |
<when> |
Time when resource was first accessed in UNIX epoch seconds |
<duration> |
Time in milliseconds from accept() to close() of client socket |
<client-host> |
Name of host of connecting client requesting resource |
<cache-result> |
Result of cache access |
<http-reply> |
HTTP reply code in response to request for resource |
<http-request> |
Kind of HTTP request made |
<user> |
Login name of user requesting resource—obtained from ident lookup if proxy server supports it and client's host allows ident lookups (Windows platforms do not) |
<access-hierarchy> |
Description of how resource was fetched |
<source> |
Source of resource |
VORTICES administrators must decide what scale of service they want to operate. This depends on several factors but two important ones are how much processing resources and space they are prepared to commit to the service. A plausible answer might seem to be a few hours of spare processing time overnight on a server and a few hundred megabytes. To be useful a VORTICES service must cover a reasonable range of resources but it does not need to cover all or even most resources accessed through a Squid proxy service. Some UK caches have a million proxy server accesses a day, some have considerably less.
The requirements for processing and storage space will be illustrated with an example calculation. Assume that 50000 log entries a day will be processed and that any excess is ignored. An average access log entry of 140 bytes will produce a 7 megabytes log each day. If 10% of these log entries are rejected, 45% of them give rise to new records averaging 900 bytes each, and 45% give rise to new references averaging 350 bytes each, then the database will have
22500*900 + 22500*350 = 28125000
megabytes of new data added every day. Now, assuming that a database of 100000 records is maintained, 22500 records will have to be deleted every day. If the database has 100000 records and each has an average of 6 references each (the minimum is 1 and the maximum is 11) then the average size of a record will be 3000 bytes and the overall size of the database will be 300 megabytes. Zebra indices will probably increase that by two thirds to 500 megabytes. If the database has only 50000 records, then the corresponding size of the records and indices will be 250 megabytes.
Between 50000 and 100000 records seems sufficient. Experience shows that for tolerable performance and bearable load times on good PCs, VORTICES visualizations must be of less than 1000 resources. Between 50000 and 100000 records will keep the range of selection at least 1.5 to 2 magnitudes greater than the range of each visualization. This should provide reasonable scope for making a selection prior to browsing.
Acknowledgements
The VORTICES project was funded by JTAP under the JISC Technology Application Programme. The project was managed by Professor Alistair Kilgour and Dr. Hamish Taylor. The VORTICES software was designed and implemented by Jeffrey Morgan, Nick Burton, Kate Patterson, and Hamish Taylor at Heriot-Watt University, Edinburgh, UK.
References
- Ahlberg C. and Shneiderman B. (1994), Visual information seeking: tight coupling of dynamic query filters with starfield displays. CHI ‘94 Proceedings (Human Factors in Computer Systems), Boston, Massachusetts, 313-317.
- Bowman C. M., Danzig P. B., Manber U. and Schwartz M. F. (1994a), Scalable Internet Resource Discovery: Research Problems and Approaches, Communications of the ACM, 37(8), 98-107.
- Bowman M., Danzig P., Hardy D., Manber U., and Schwartz M. (1994b), The Harvest Information Discovery and Access System, Proceedings of the Second International WWW conference, Chicago, 763-771.
- Kirby R., McAndrew P., Kilgour A., Taylor H., Mayes J. T. (1995), ELF: The Electronic Learning Facilitator, Journal of the Association for Learning Technology, 3(1), 69-74.
- Luotonen A. and Altis K. (1994), World Wide Web Proxies, Proceedings of 1st International Conference on the World Wide Web.
- Shneiderman B. (1993), Sparks of Innovation in HCI, Ablex Publishing Corp.
- Shneiderman, B. (1996), The Eyes Have It: A Task by Data Type Taxonomy for Information Visualizations, Proceedings of Visual Languages 1996.
- Sykes P., Mayes M. and Kilgour A. C. (1993), Electronic Learning Facilitator, grant application under NTI to JISC: 1-5.
- Taylor H., Kilgour A. C., McAndrew P. and Mayes M., Intelligent Discovery of Information On MANs in Scotland, grant application under UMI to SHEFC, pp. 1-9, August 1995.
- Zizi M. and Beaudouin-Lafon M. (1994), Accessing hyperdocuments through interactive dynamic maps. ECHT ‘94, Edinburgh, 126-135.