Literary Atlas of Wales
The Literary Atlas of Wales is an interactive online atlas that offers a range of maps that locate twelve English-language novels set in Wales. The Literary Atlas is implemented as a Django Python web application that makes extensive use of Leaflet maps, D3 visualizations and JavaScript-powered story maps to provide a highly interactive exploration of the novels.
The Home Page
The Home page provides a number of animations to introduce the content of the website. Each animation is triggered when the page reaches a specific scroll position. The first animation presents the cover of each novel as a circle. Each circle is centred on the primary location of the novel over an SVG background map of Wales.
Next, scale animations present the novels, authors and artworks specially commissioned by the Literary Atlas project to visually represent the themes of the novels. Clicking on the novel covers, the author profile photos or the artworks leads to more detailed information.
The final home page animation translates and scales SVG images of the mobile and desktop devices on which the Literary Atlas will be viewed.
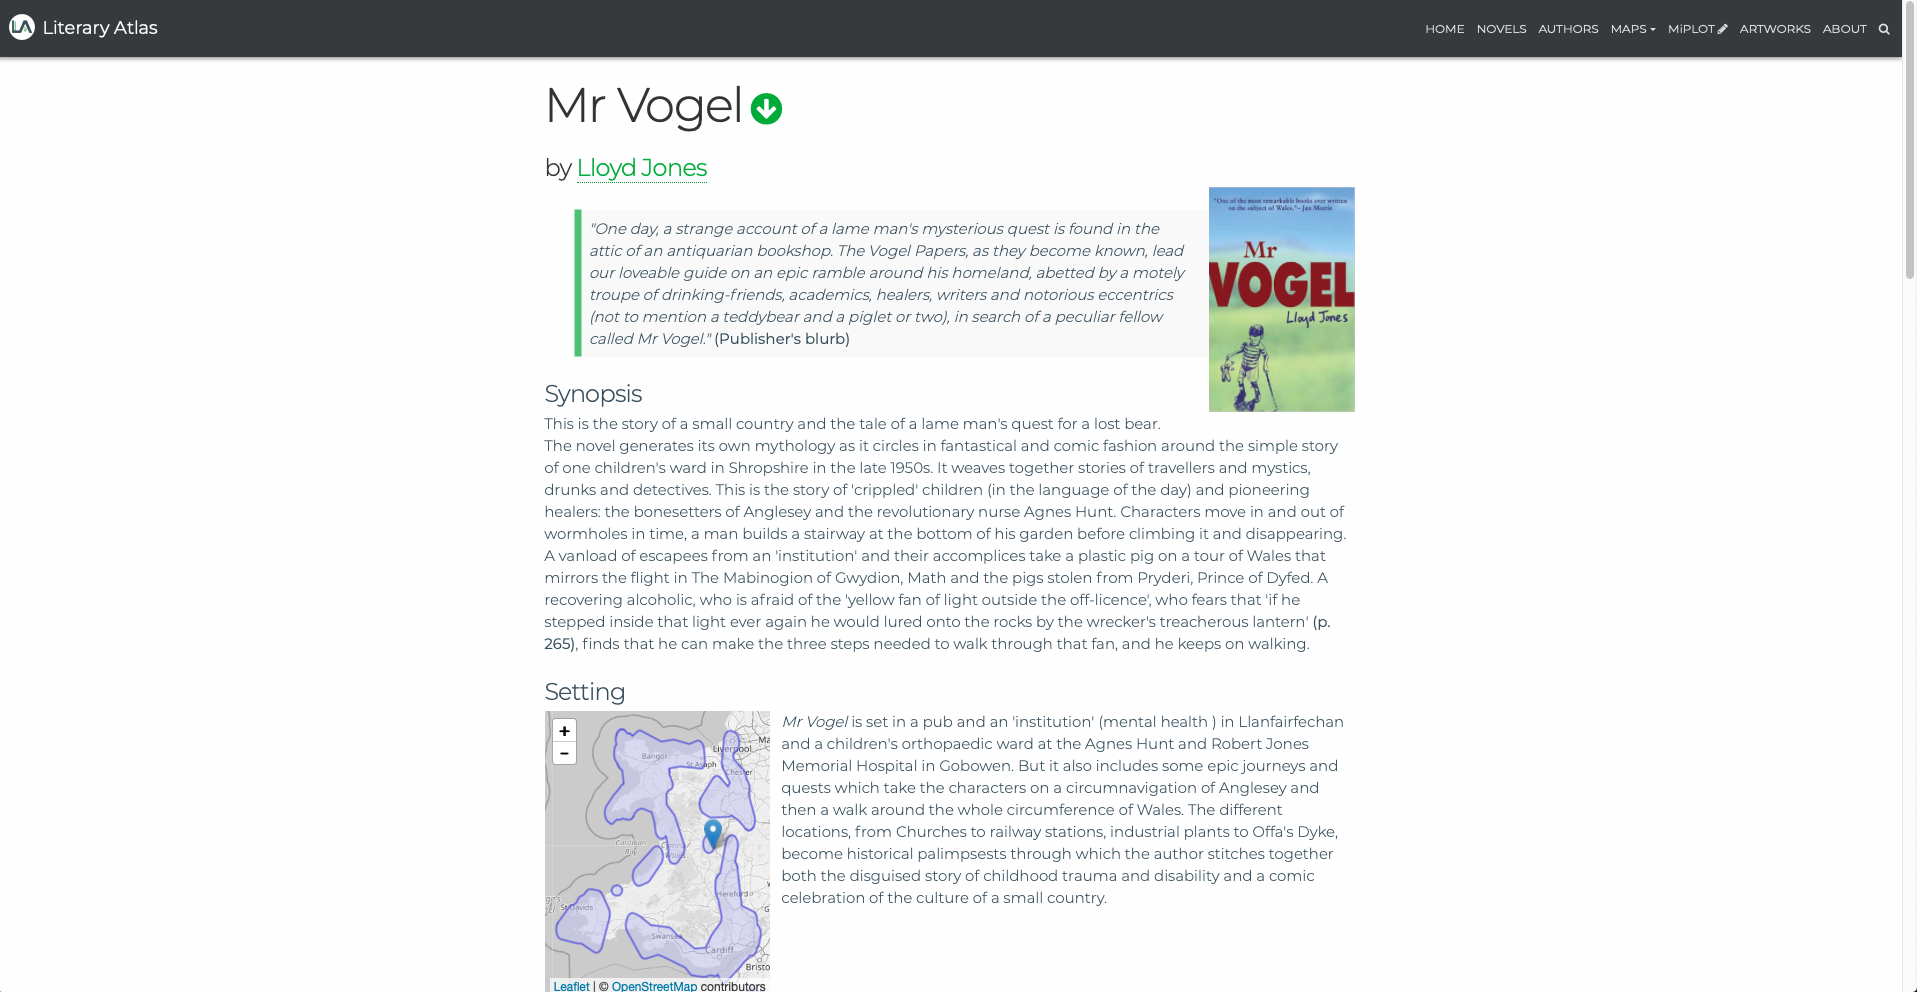
Novel Overview Page
Each novel has an an overview page that introduces the novel and locates the main action in the novel with an embedded leaflet map. The map has a D3 overlay that shows the geographical region covered by the locations in the novel.
Novel Plotlines Page
Each novel has a set of plotline page that guides the reader through a sequence of locations as they occur in the story. Each plotline through the novel is presented as a storymap, which is a user interface style that combines a narrative sidebar on the left and a map and visualization area on the right. As the reader scrolls the sidebar from one section to the next, the map updates the location and content to match the narrative in the current section. Zooming and animation techniques add and remove overlays to provide information relevant to the current position in the story.
Maps
The Literary Atlas provides an extensive set of maps in various projections that present the locations in the novels.
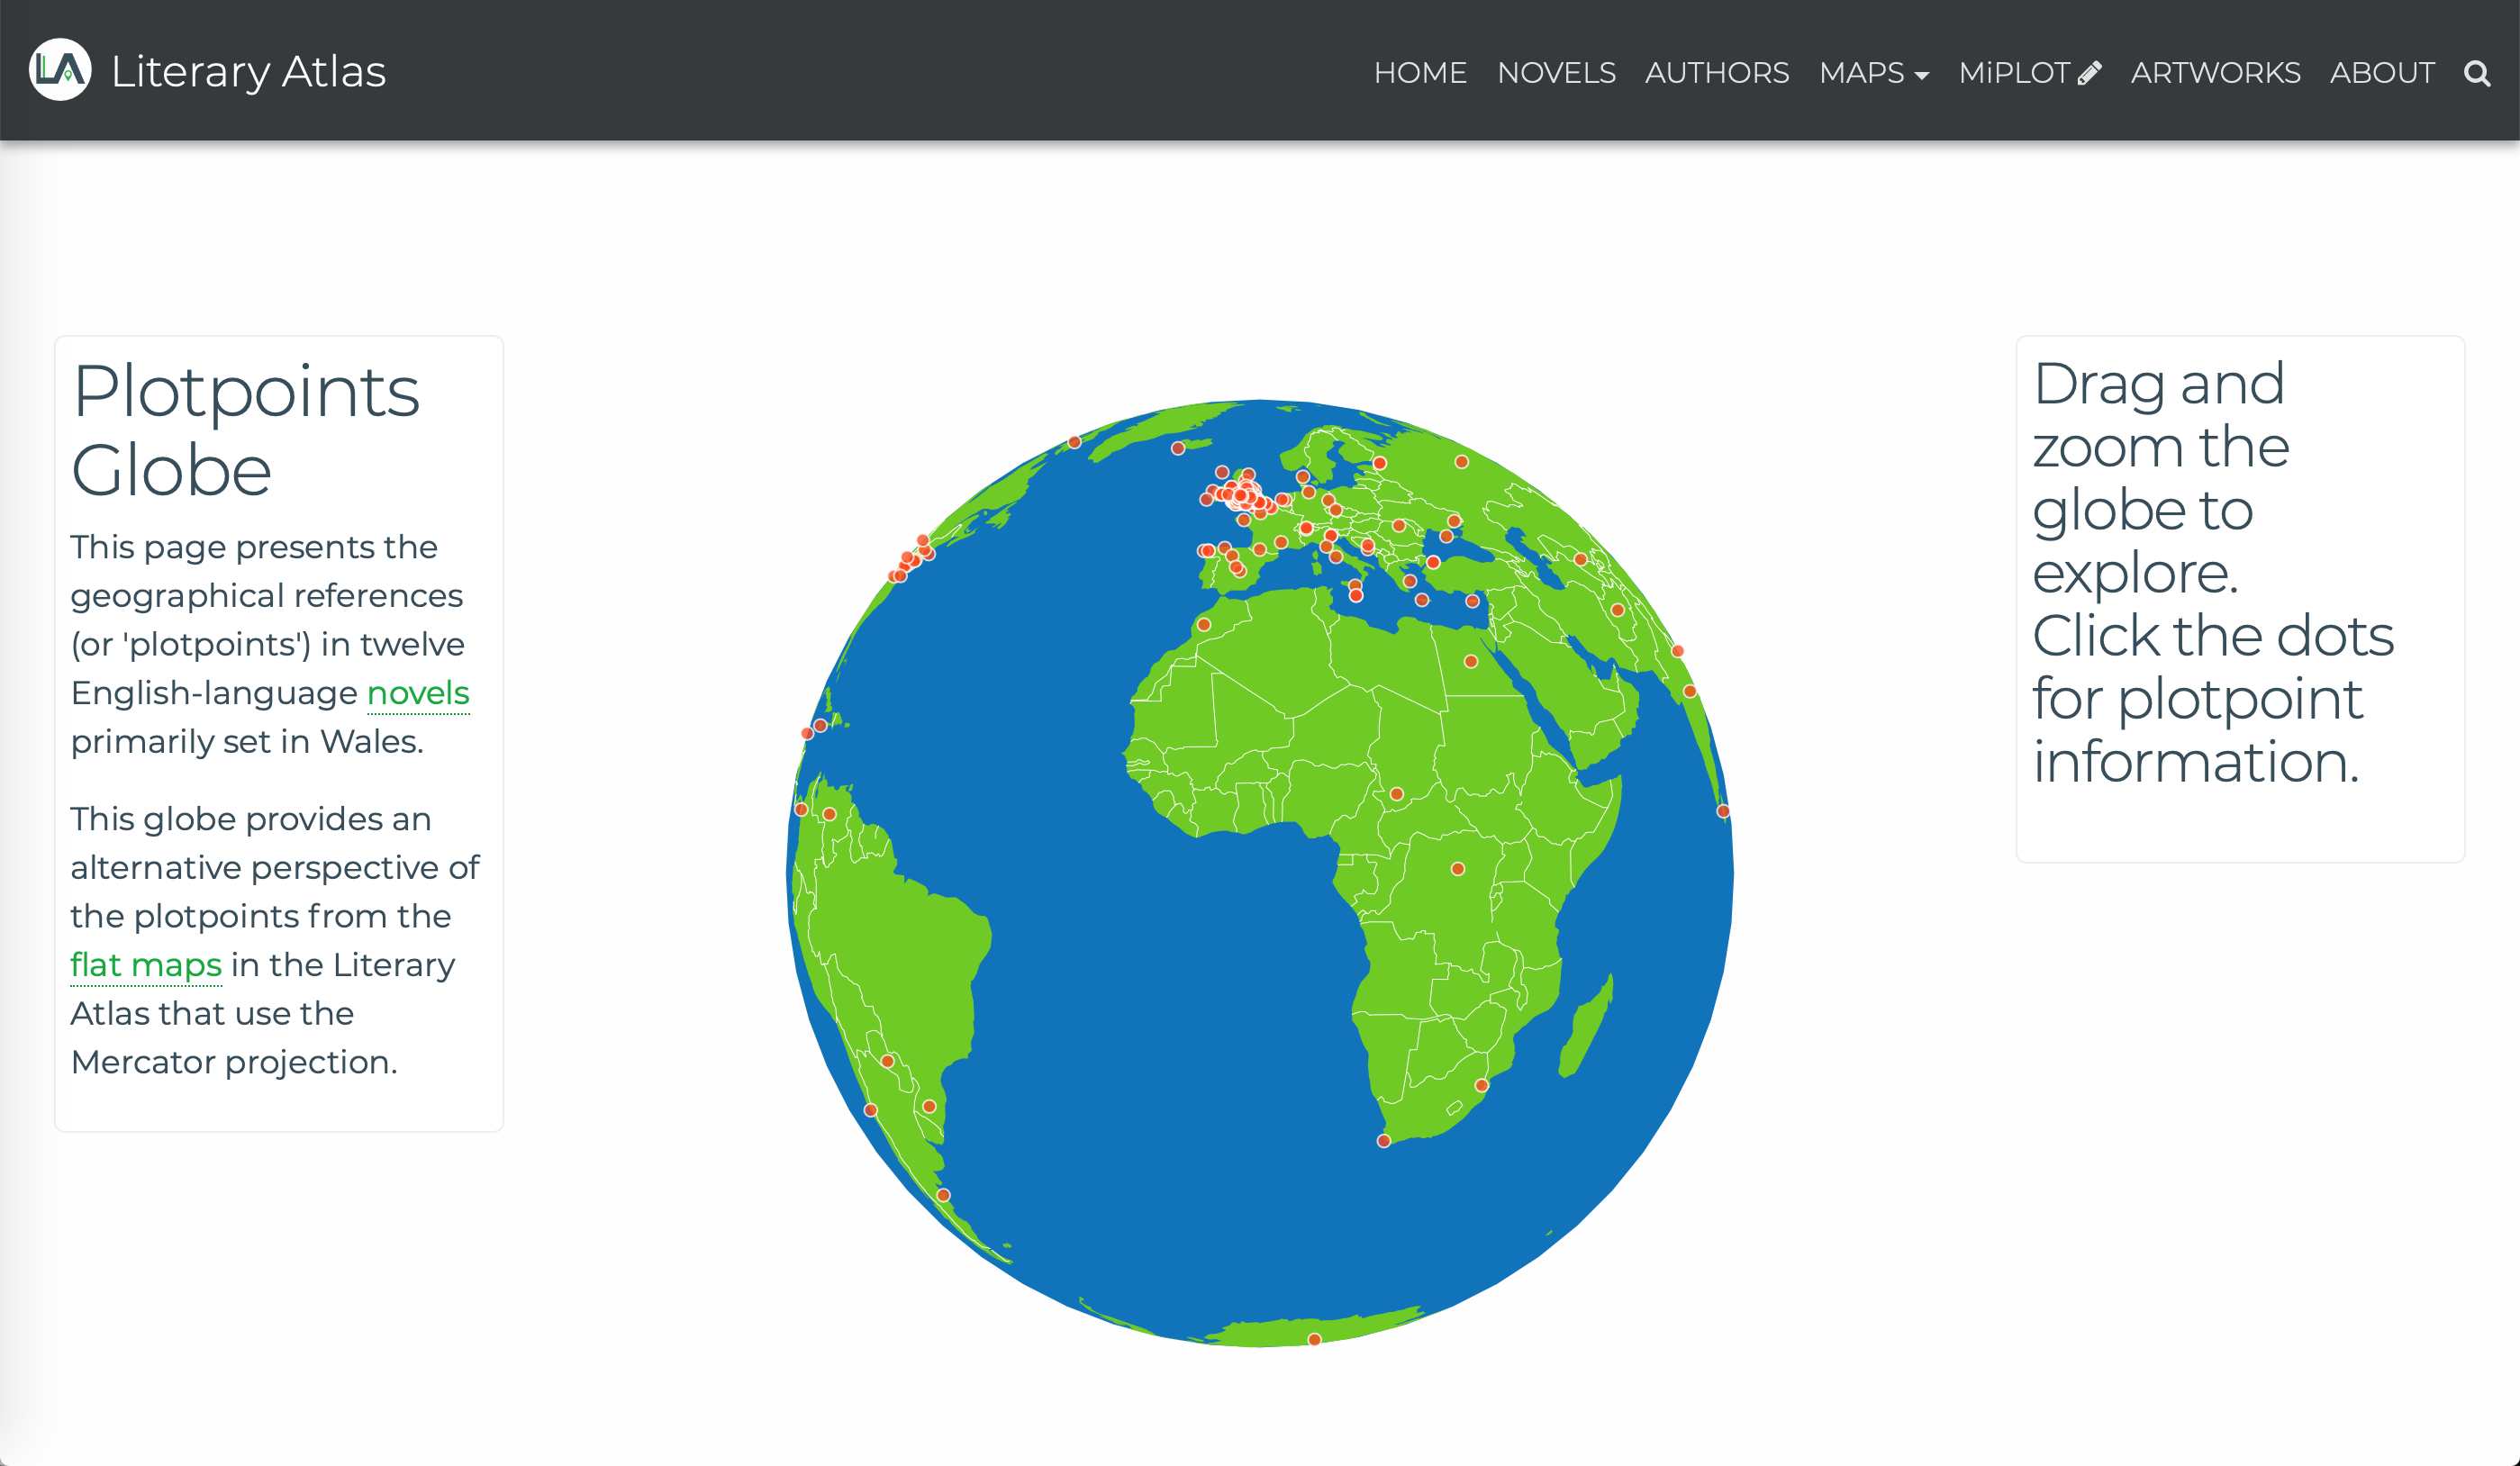
Globe
The Globe page presents the novel locations as points on a 3D globe. Dragging with the mouse rotates the globe to reveal the worldwide locations. Zooming with the scroll wheel brings the reader closer to the locations until the globe transitions into a traditional 2D map.
Locations
The locations map presents locations as markers on a greyscale Leaflet map. When zoomed out, the map clusters the markers into groups represented by circles labelled with the number of markers in the cluster.
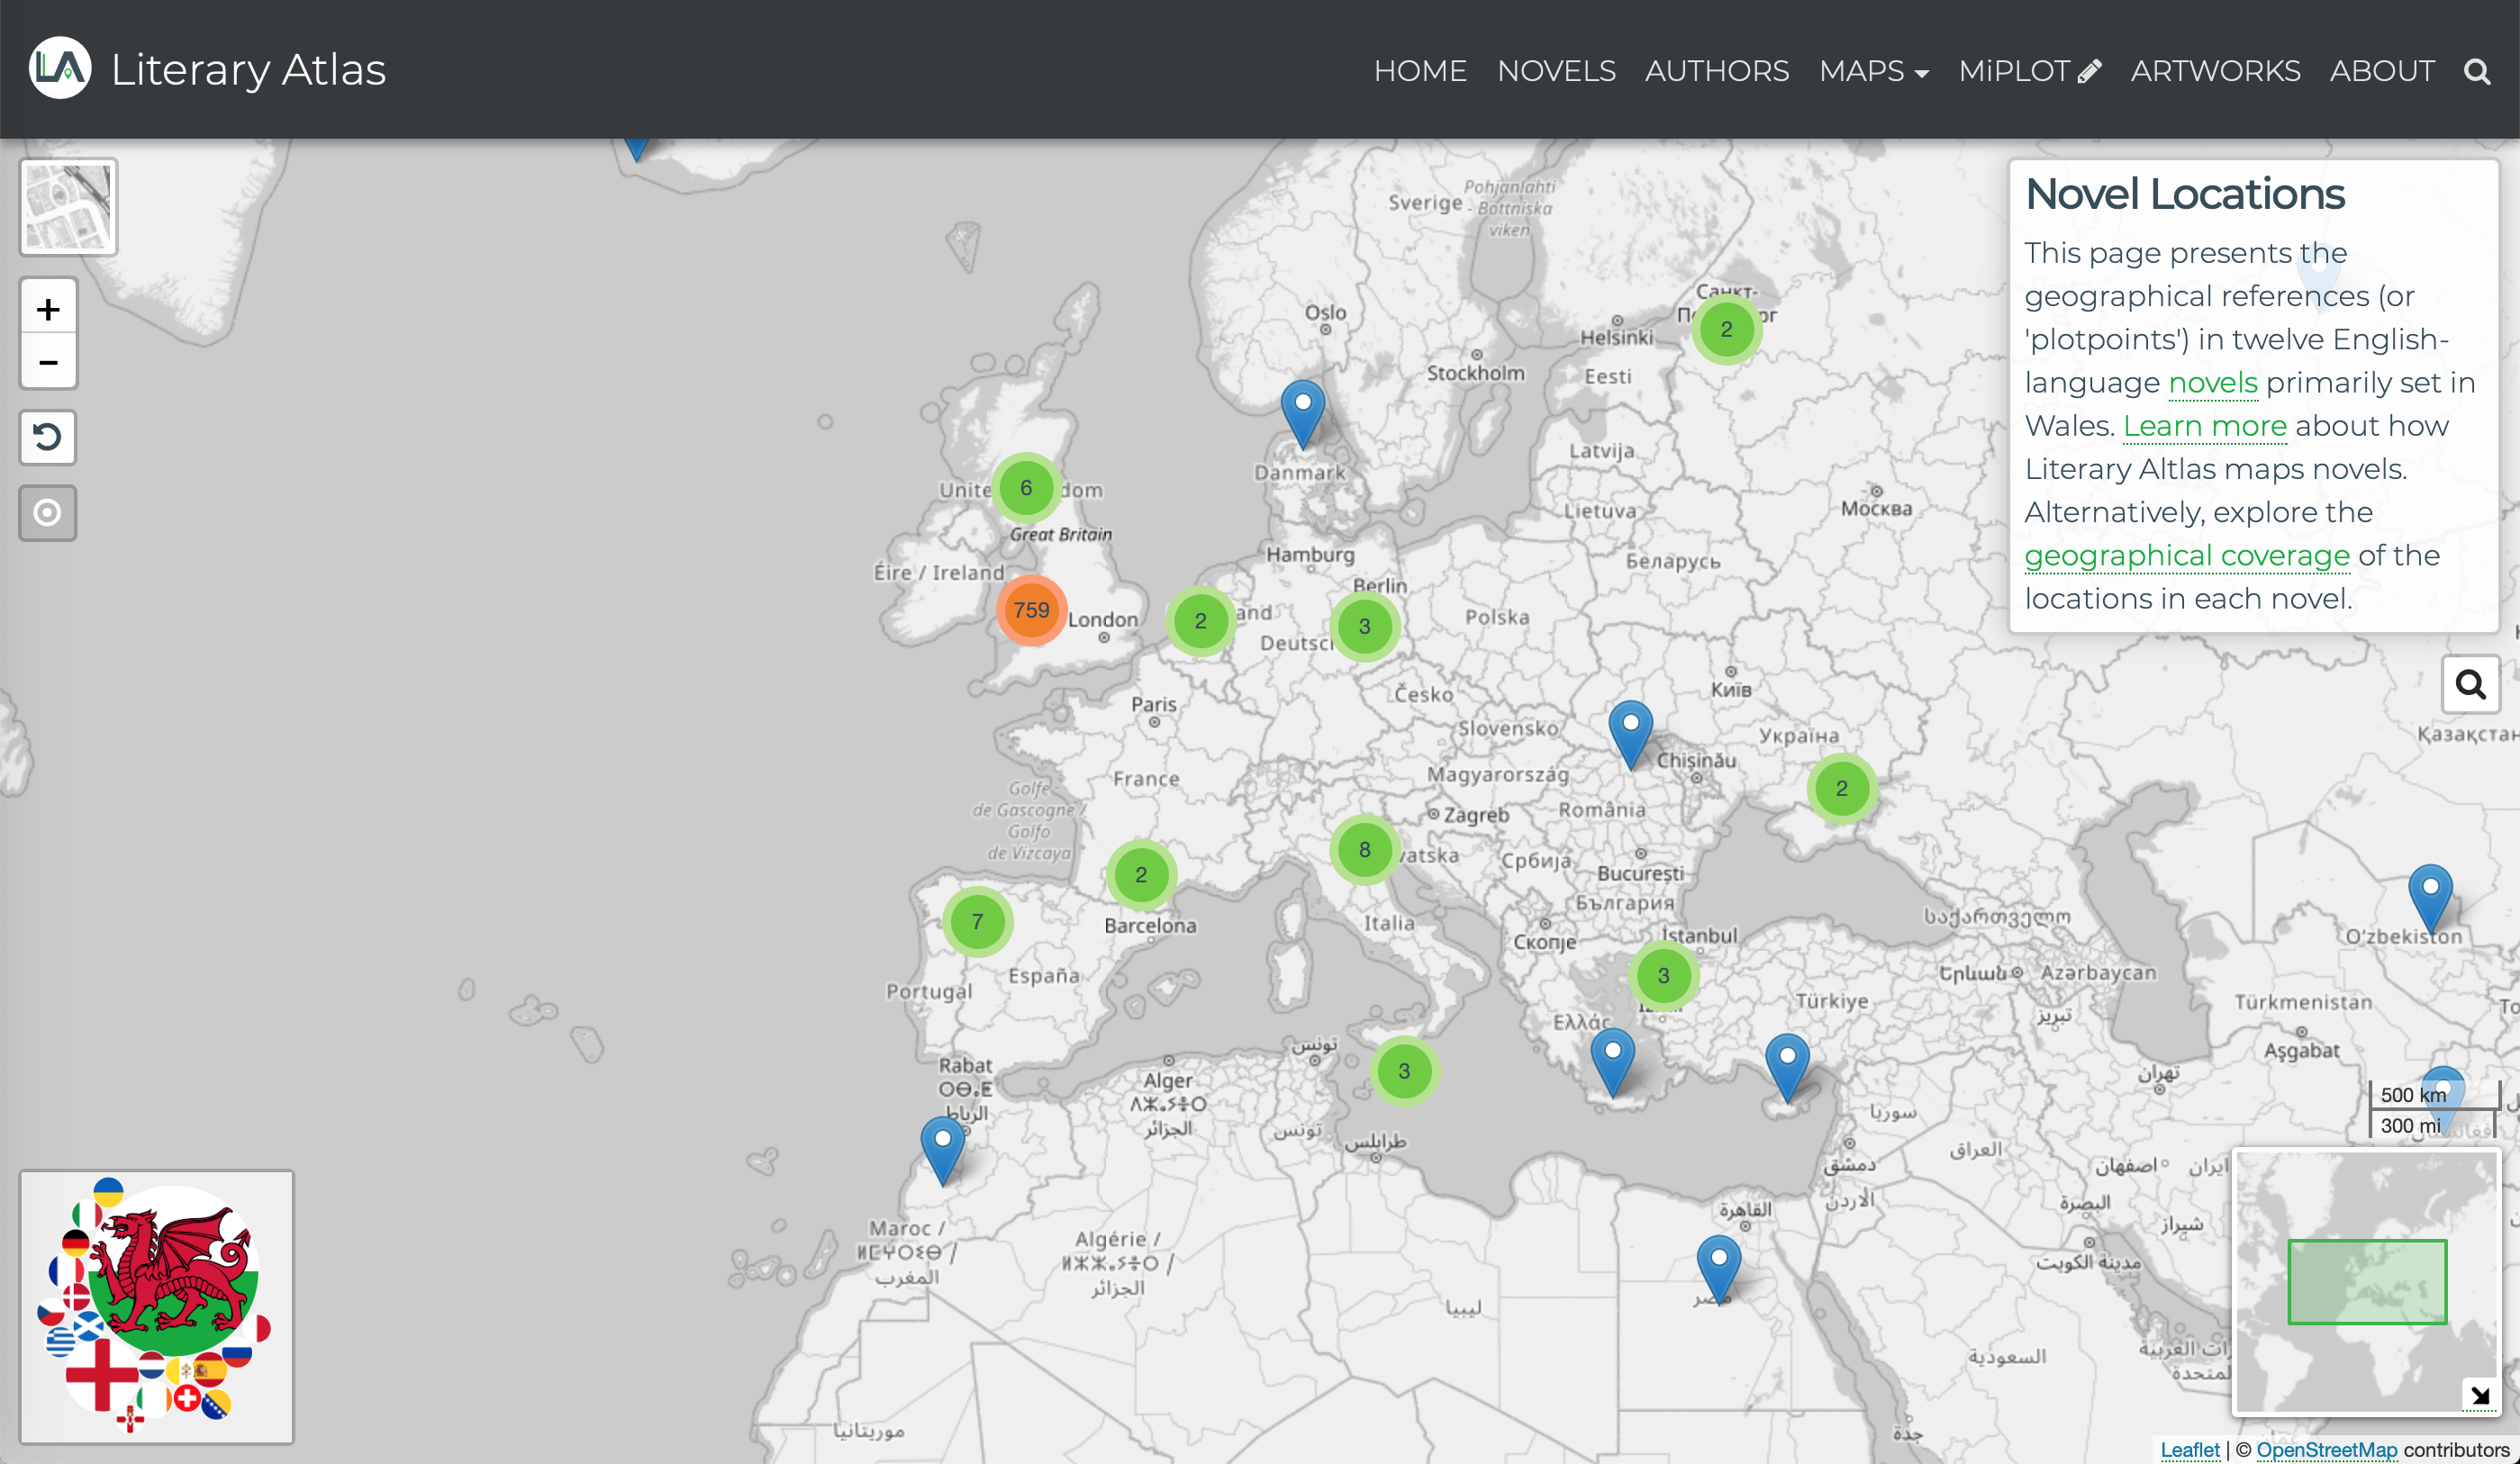
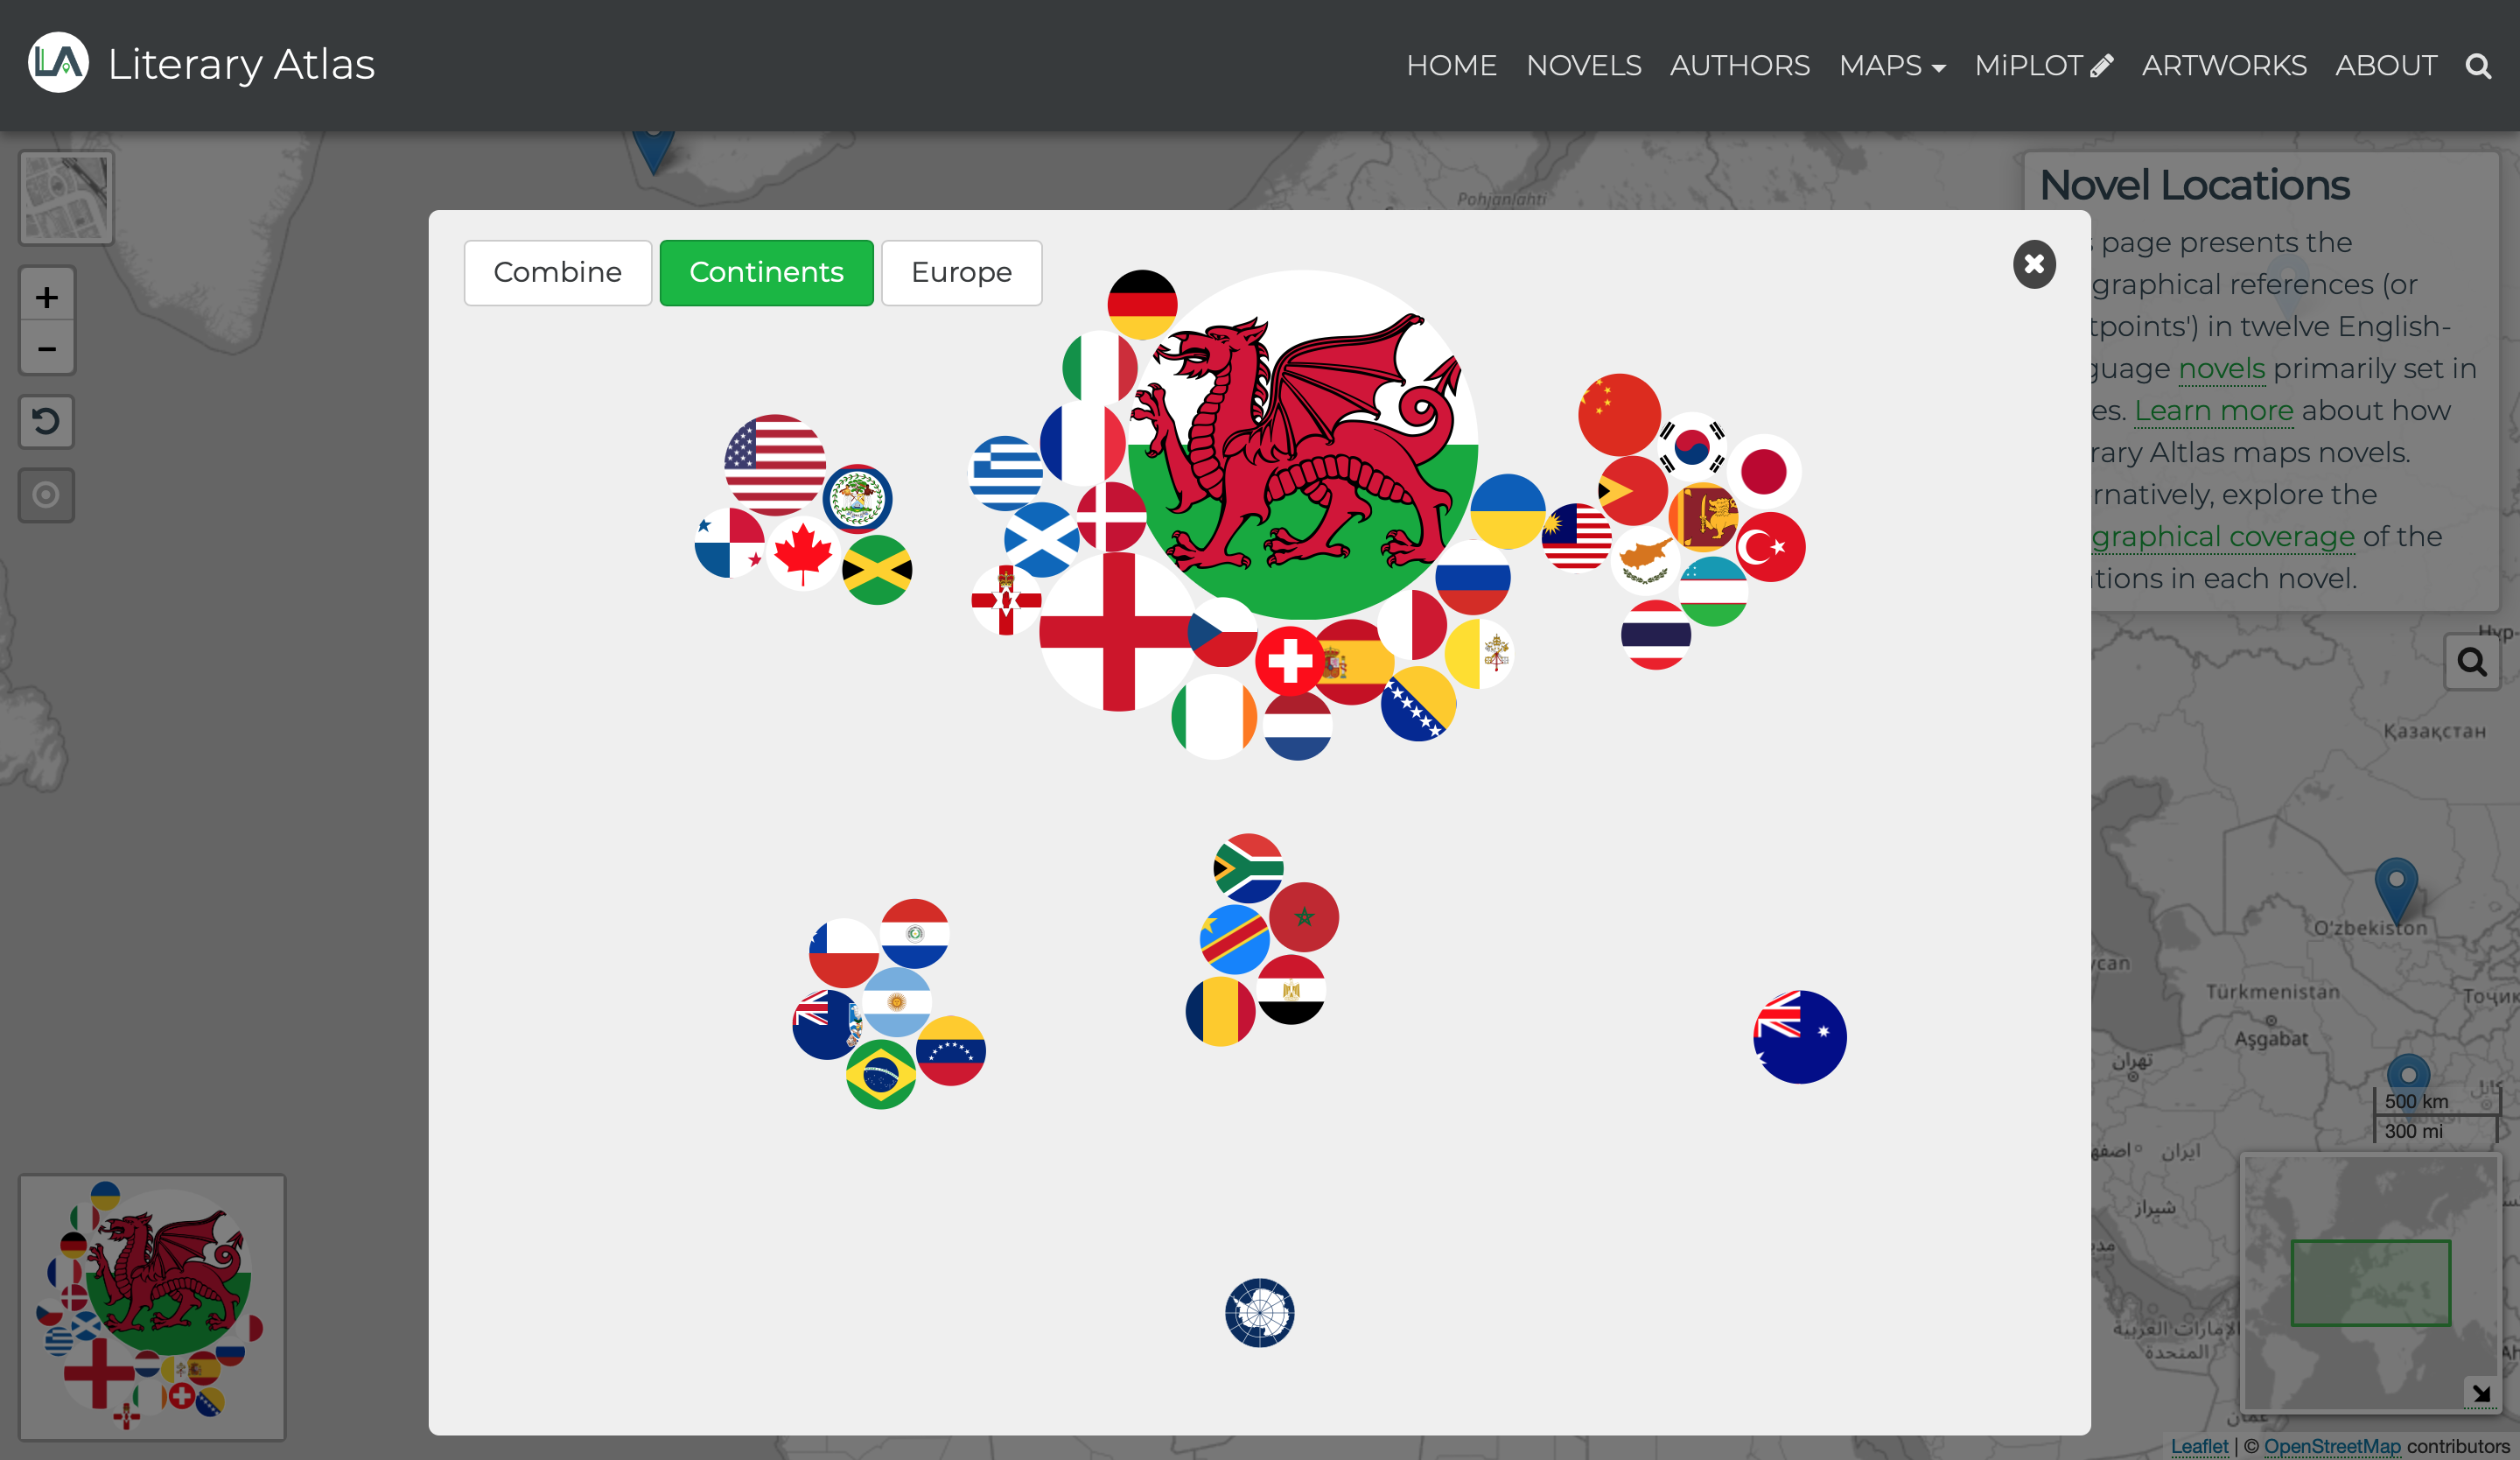
Clicking the square icon at the bottom left opens an animated D3 visualization that presents the number of locations in a country as the area of a circle filled with the flag of that country. The circles can be positioned geographically over the centre point of each country or abstractly into two groups that contain the countries in Europe and those countries not in Europe.
Coverage
The Coverage page shows the geographical regions covered by the locations in the novels. The region covered by each novel is represented by a D3 SVG layers added on top of a Leaflet map. The interactive sidebar enables users to show or hide regions and change their colour, as demonstrated in the following video.
Plotlines
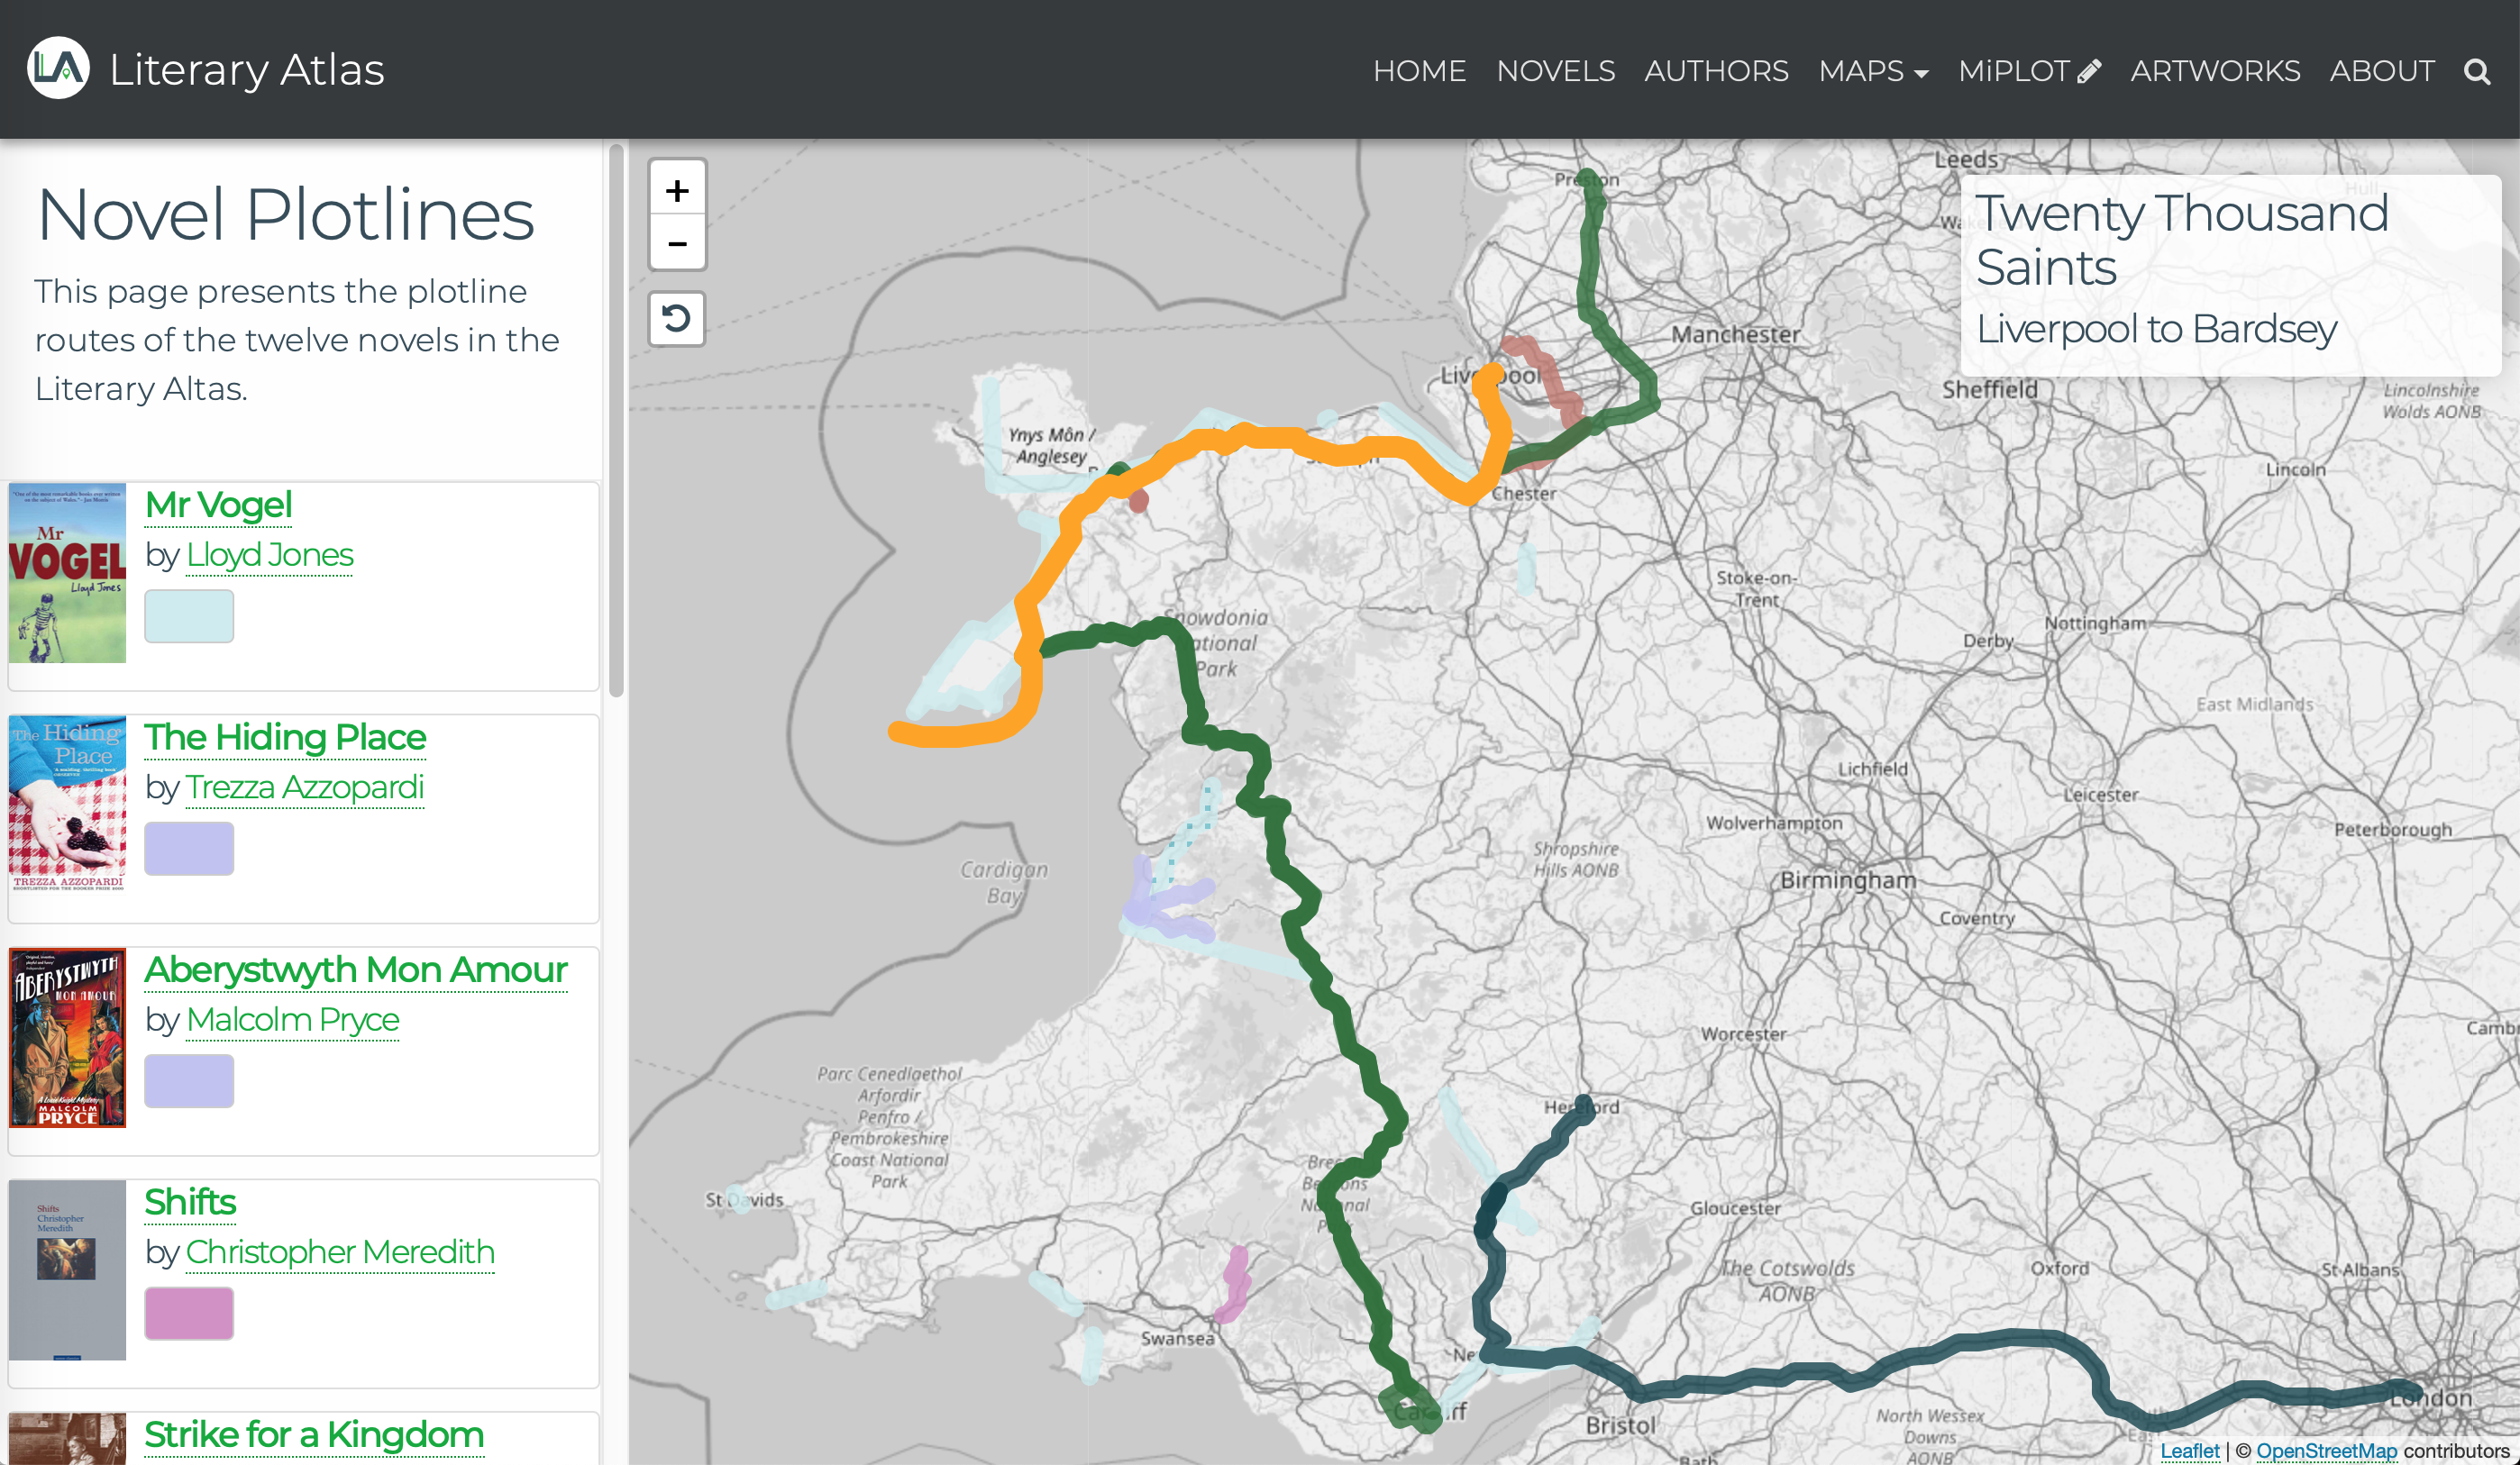
The Plotlines page groups all the plotlines for the novels together onto one map. Each plotline is represented by a D3 SVG layer added on top of a Leaflet map. This view shows how the regions covered by the novels converge or diverge.
Library
The Library page presents an interactive Leaflet and D3 visualization of the primary locations of over 500 novels published between 1800 and 2000. At the top right is a double-ended slider that controls the range of publication dates; novels published within this range are presented as dots on the map and are listed in the table below the map. Below the slider is a histogram showing the number of novels published in each year. The following video demonstrates the publication date range control.
Writer’s Plaques
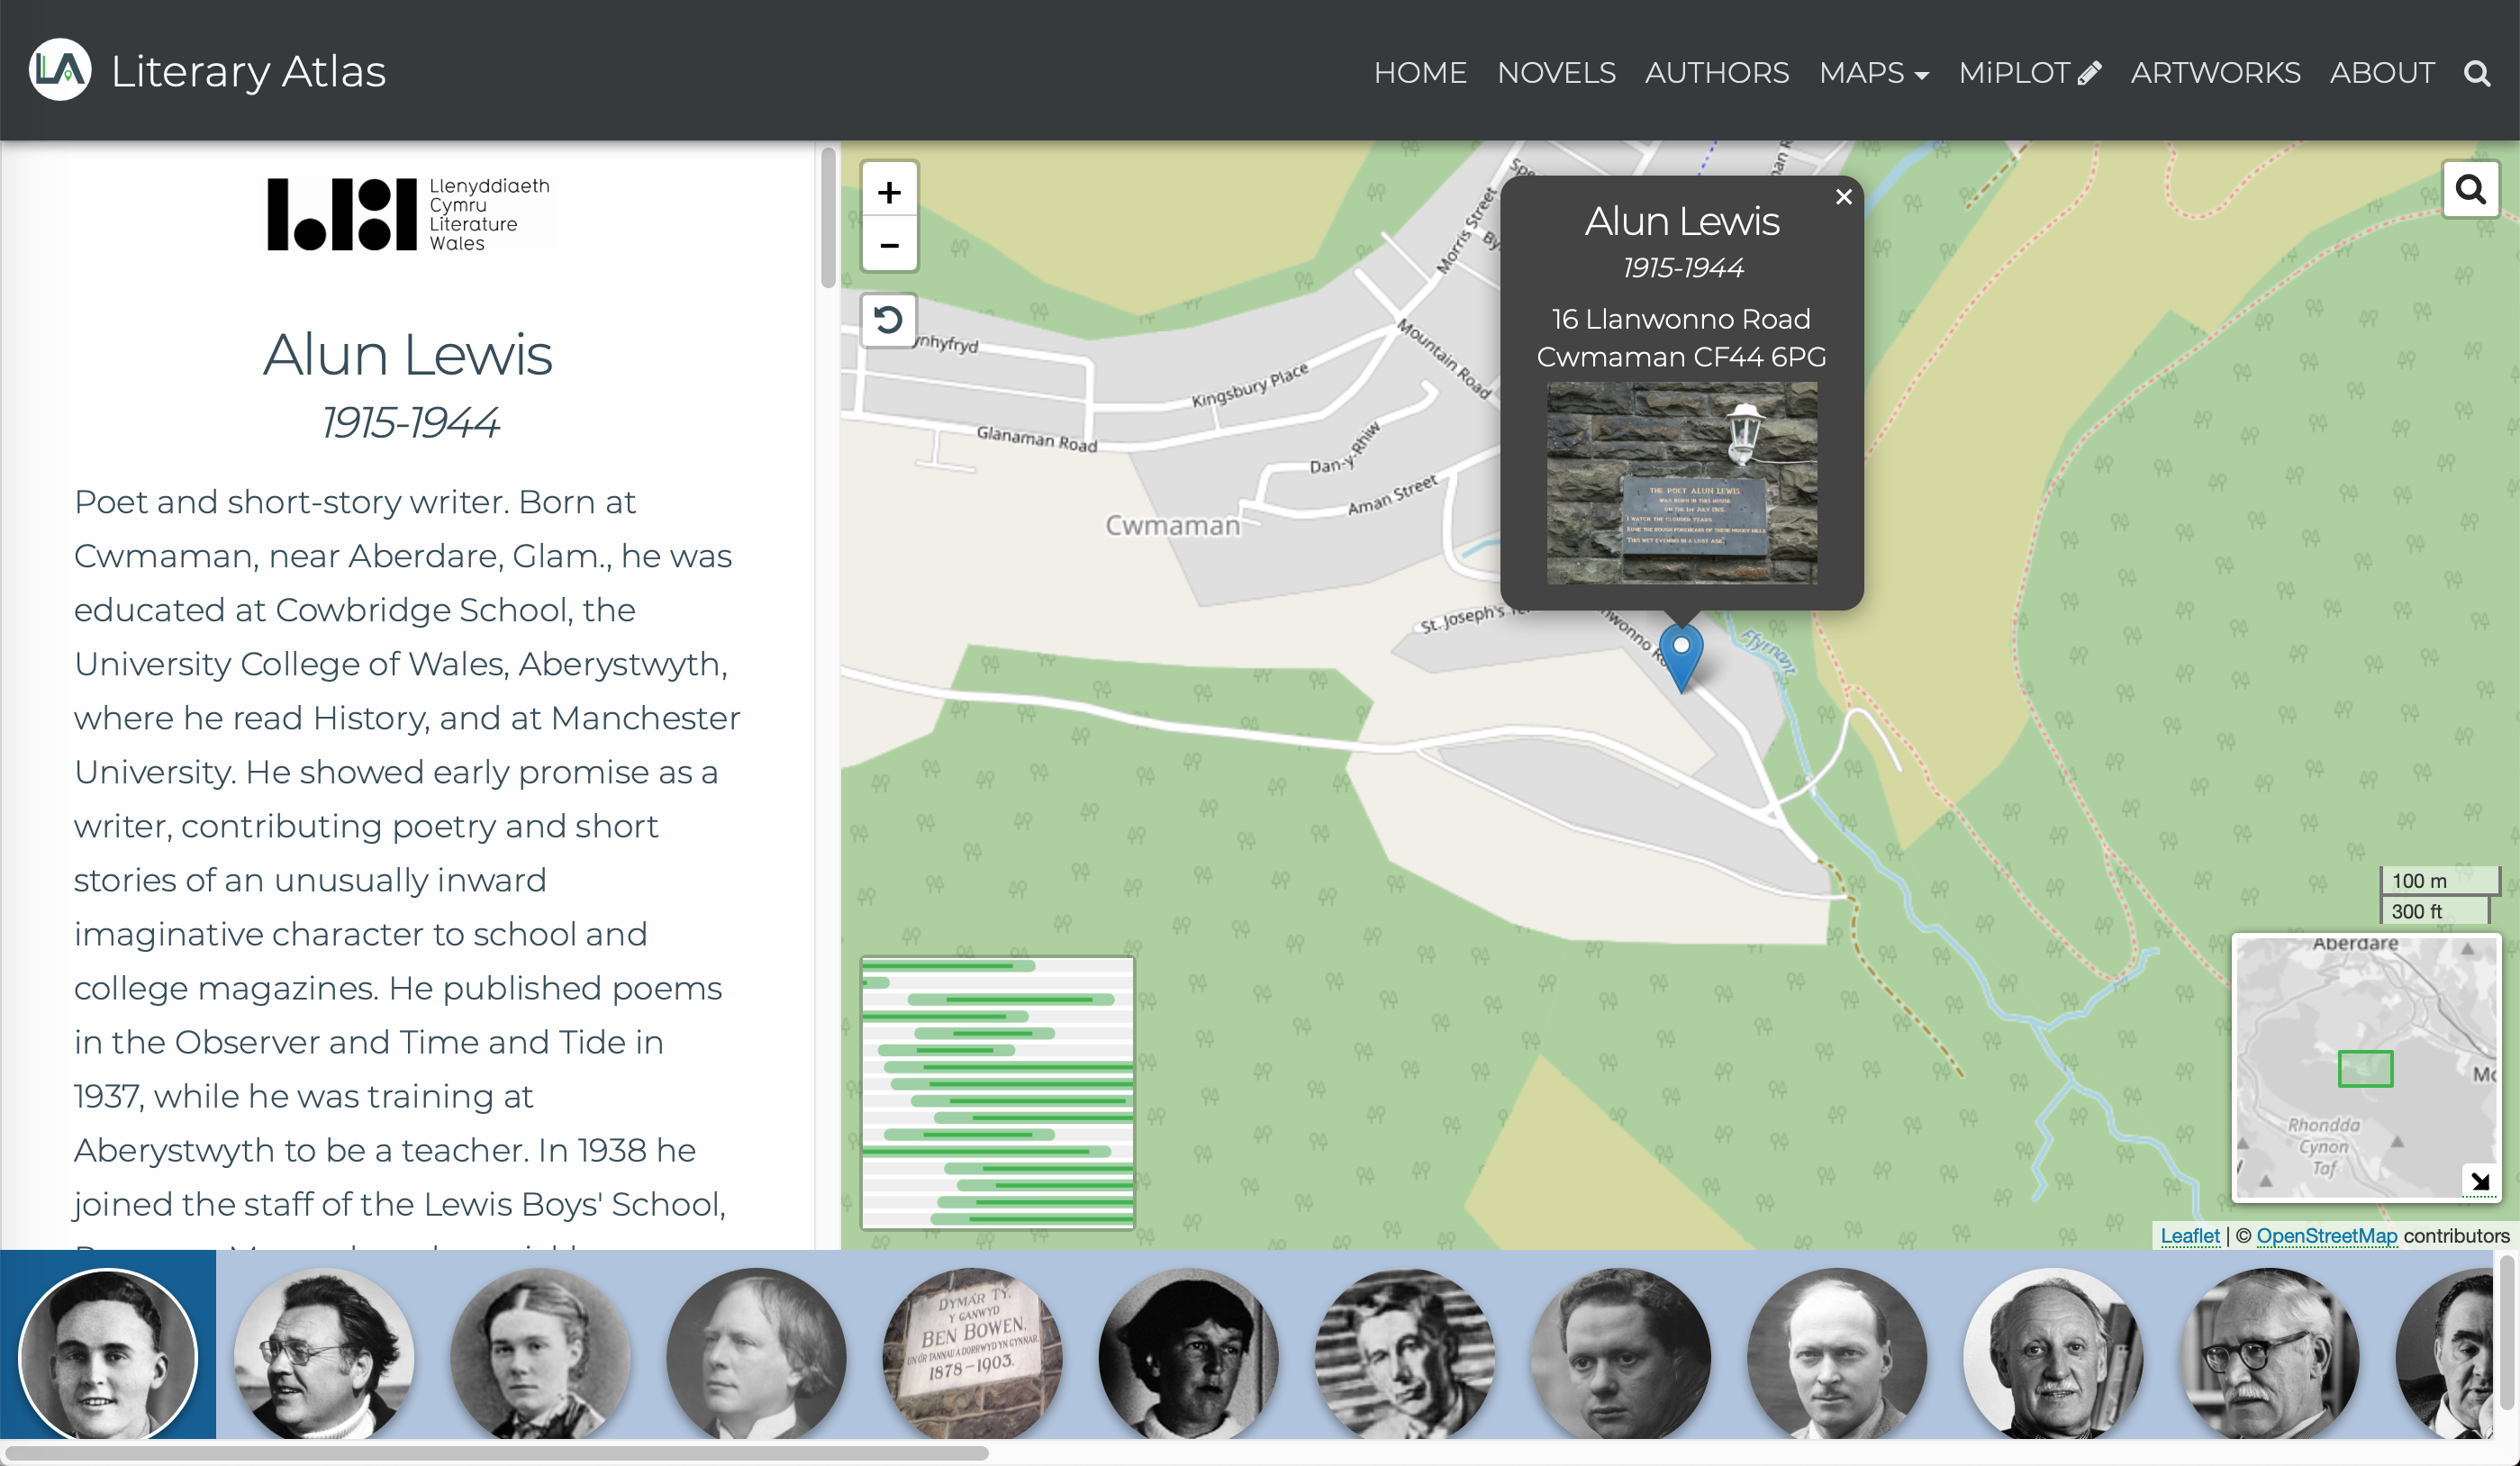
The Writer’s Plaques page shows the locations of the blue writer’s plaques that link geographical sites with famous Welsh writers. Clicking on the photo of each writer zooms the map to the location of the blue plaque and updates the left-hand sidebar with information about the writer.
Clicking the square button at the bottom left of the map opens an interactive D3 visualization that presents a comparison of the life- and work-spans of the blue plaque holders, as described in the following video.
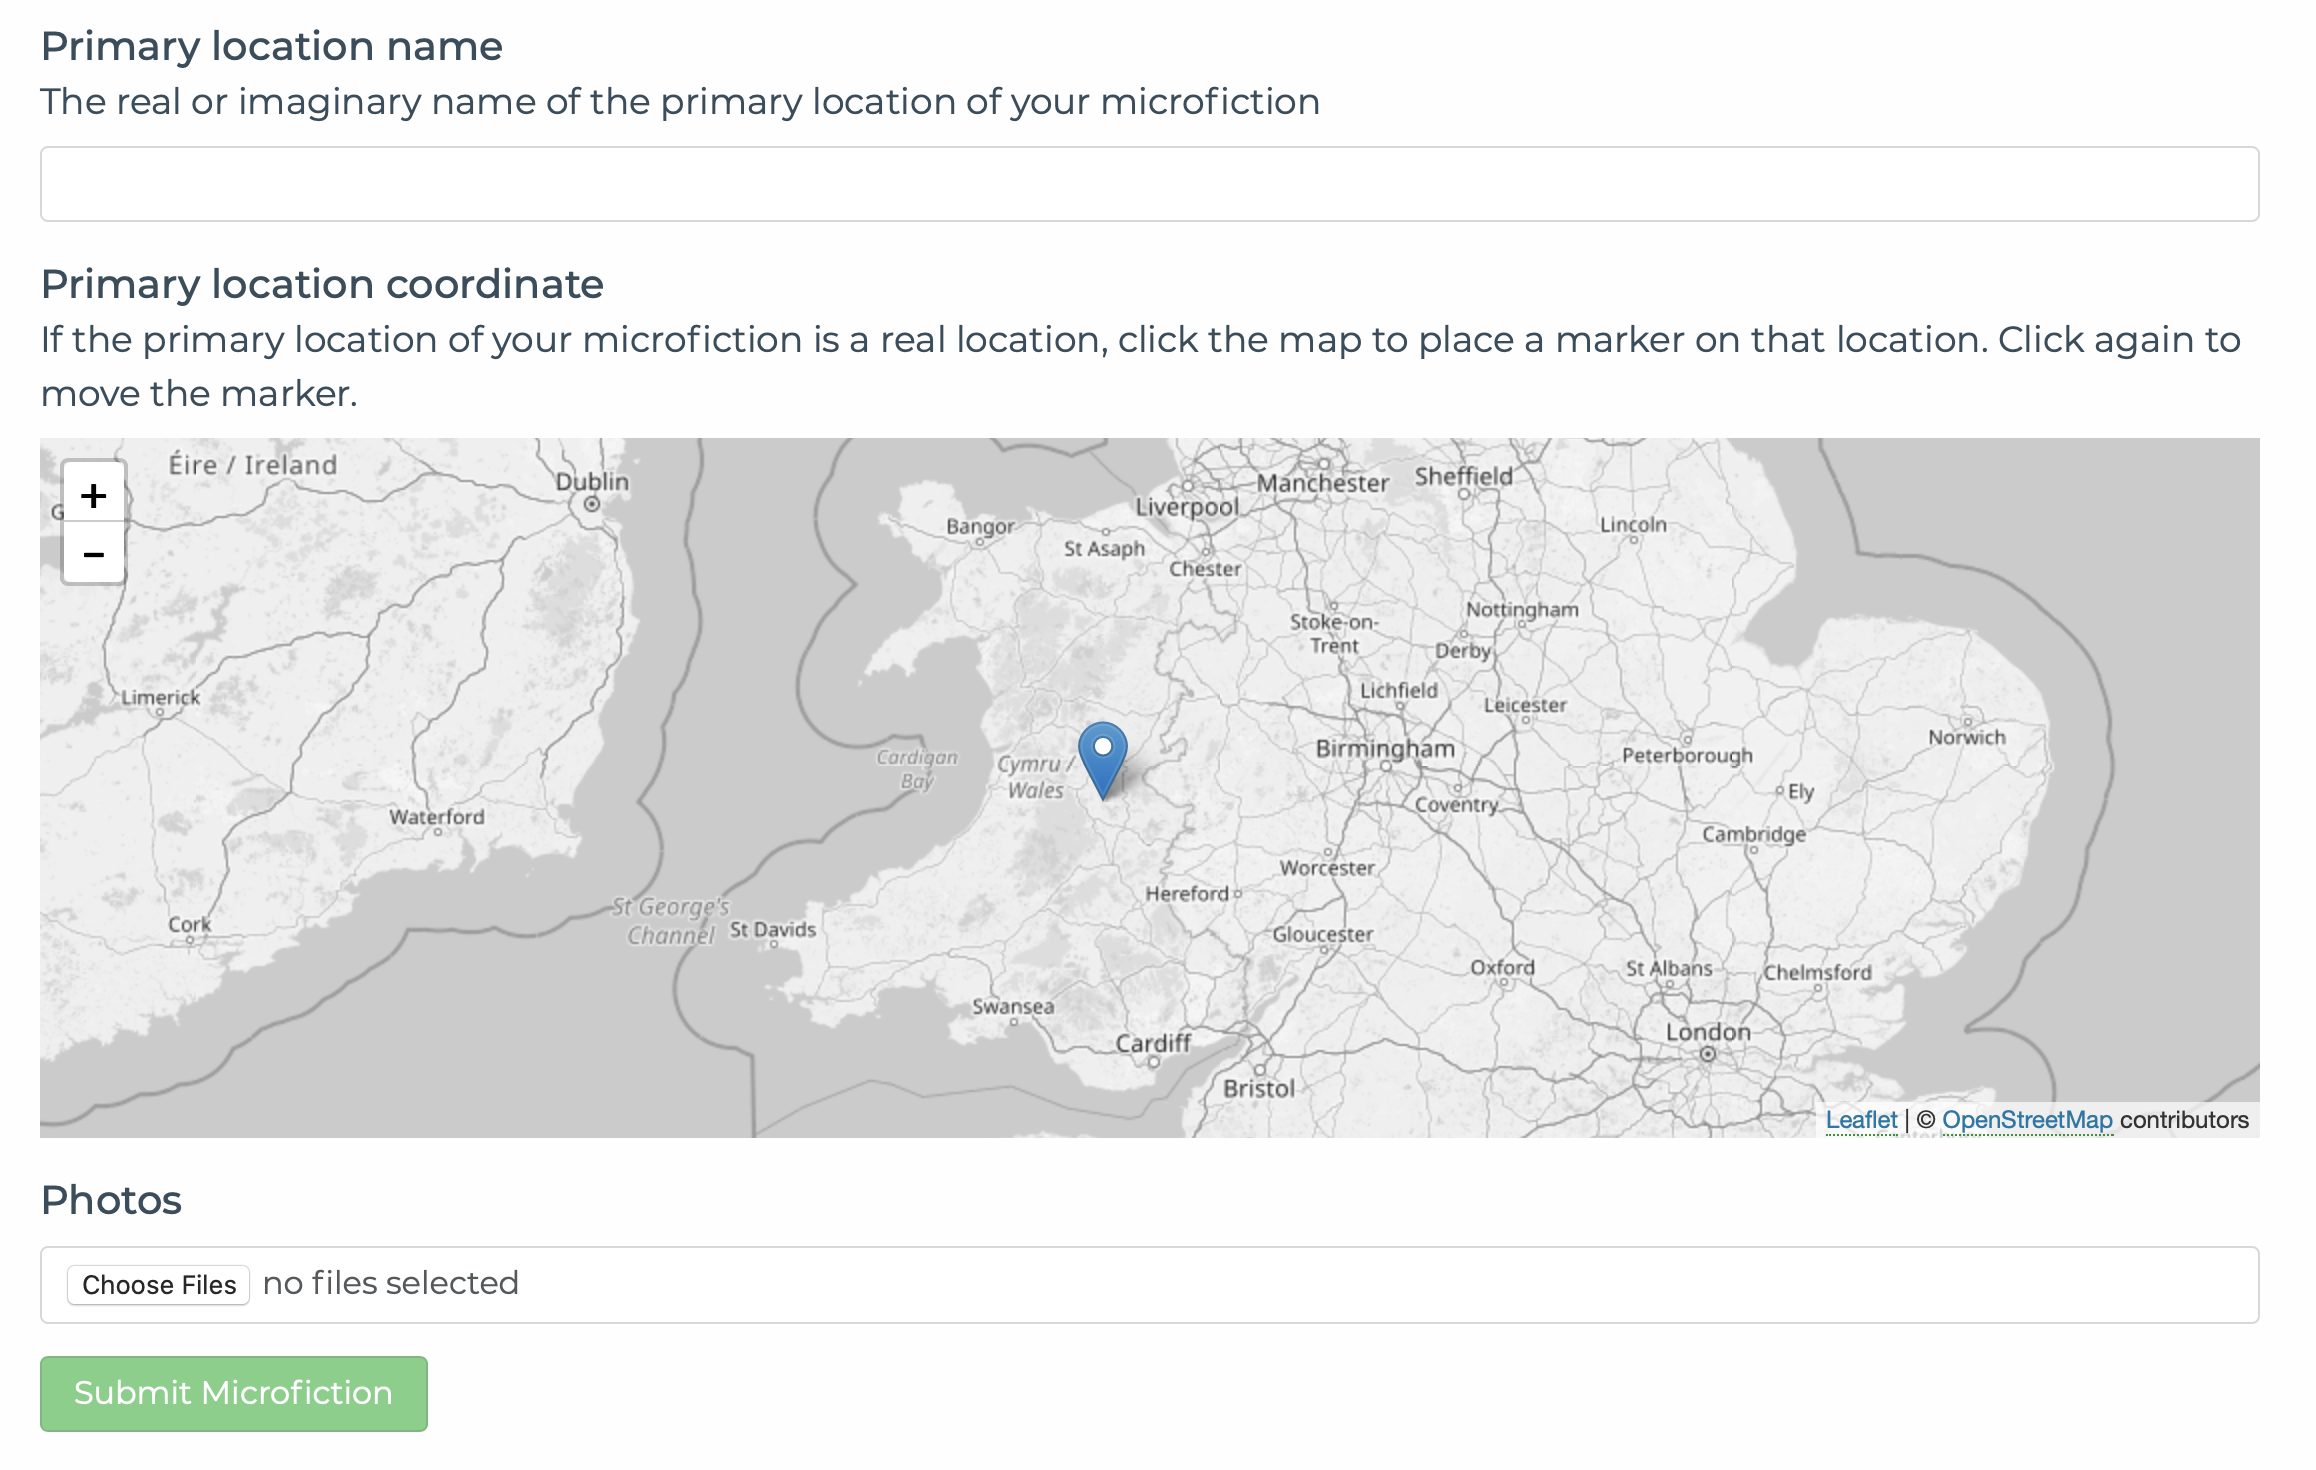
MiPlot
The MiPlot page enables anyone to submit their own microfiction story to the Literary Atlas. Microfiction authors complete a web form with details about and the content of their microfiction. An important element of a Literary Atlas microfiction is the geographical location of the story. To make it easy to specify the latitude and longitude coordinates of a microfiction, I created a custom Django form control that enables coordinates to be selected by clicking on a map.