
Using Transparency to Visualize Information Density
This article explains how to use transparency to visualize information density. When visualizing geocoded data points on a map, for example, it’s common to plot each location with a marker. When many data points are located in the same geographical area, the markers drawn later will overlay the markers drawn earlier. When the markers are opaque, it’s difficult to tell at a glance how many data points are located in each region. The following example shows geocoded tweets authored about the Boston marathon.
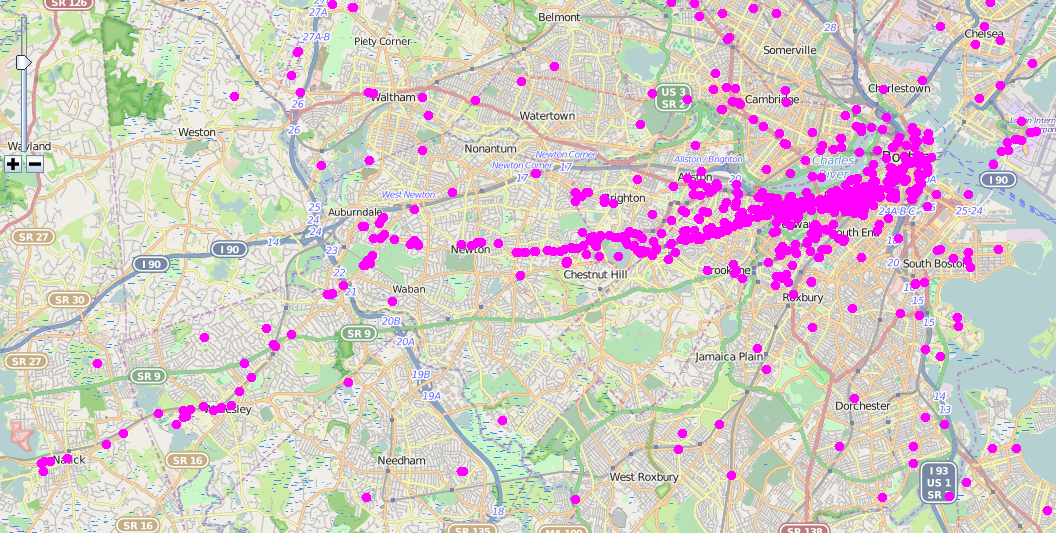
In this example, it’s clear that the tweets follow the marathon’s route. However, it’s not clear where the greatest concentrations of tweeters are. Zooming into the map is one way to move the markers apart to reveal the markers underneath. However, this requires an extra interaction that can be avoided with transparency.
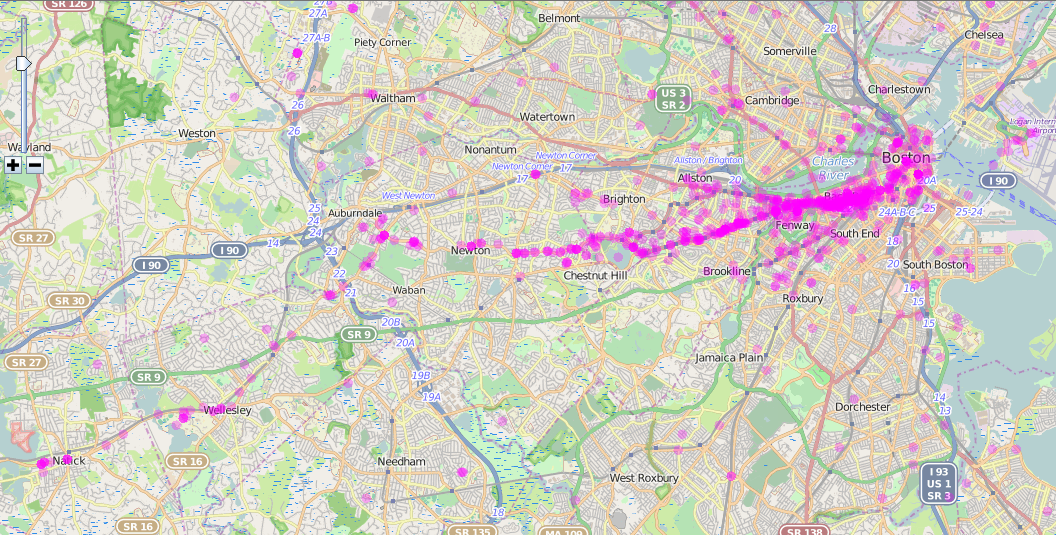
When map markers are drawn in a transparent colour, the accumulation of pixels in the same map region increases the density of the marker colour in that region. The viewer can see at a glance that areas with a deeper shade of colour represent more data points. The following example shows the same data drawn with transparency. The concentrations of tweeters are now clearly visible.
Using transparency is a very simple technique that involves adding the alpha channel to the colour. In the RGB colour model, each colour is described with three components: red, green and blue. In the RGBA colour model, a fourth component, alpha, is added that controls the transparency of the colour formed by the values of the red, green and blue components.
The following example shows a Google map with a set of circular overlays centered on points of latitude and longitude. Although some circles have greater area than others, by drawing the circles in a transparent colour, the circles beneath other circles are not obscured and the overlapping pixels build up the colour density.
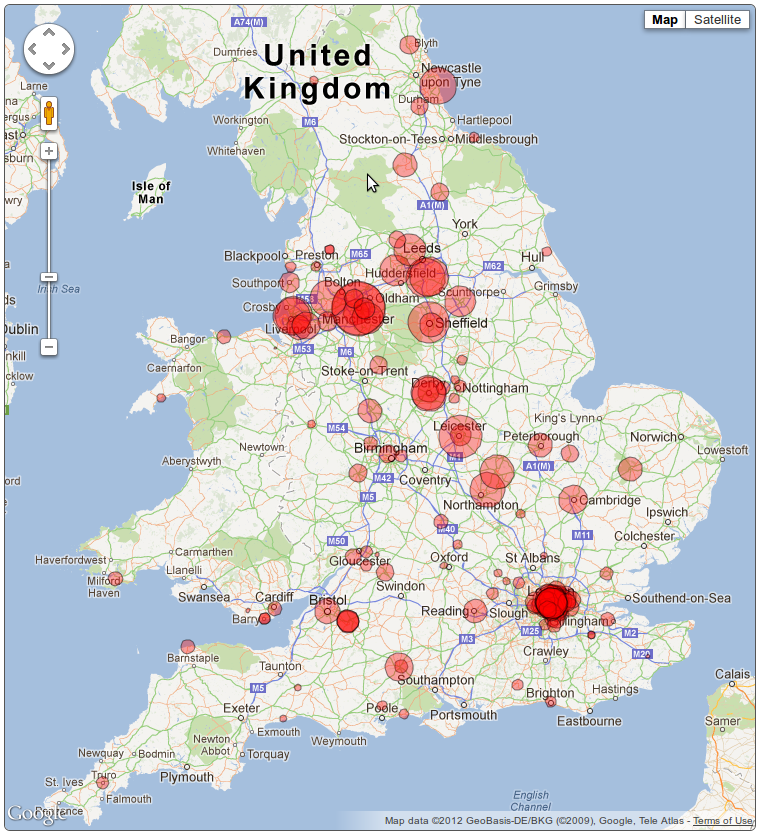
To add transparency to Google map overlays, simply set the fillOpacity property for the overlay. The value of the fillOpacity property ranges from 0 to 1, where 0 is fully transparent (i.e. invisible) and 1 is fully opaque.
The following code snippet shows how to create a red circular Google maps overlay with 35% opacity. The fillColor property value of #FF0000 sets the colour of the circle to red. The fillOpacity property value of 0.35 sets the opacity to 35%.
// Create a new circular Google Maps overlay
circle = new google.maps.Circle({
  center: latLng,
  radius: radius,
  strokeOpacity: 0.5,
  strokeWeight: 1,
  fillColor: "#FF0000",
  fillOpacity: 0.35,
  map: map,
});
Although 35% is a low opacity value, each circle must have a low opacity value to create the density effect when the pixels of one circle are drawn on top another circle.