
The Expanding Table—A User Interface Control for Visualizing Tabular Data
This article describes the Expanding Table, a tabular user interface component that enables table cells to expand and contract with smooth animation. The Expanding Table can be used for visualization and browsing applications, and when the user interface component for editing table cell values would make a table prohibitively large. The Expanding Table enables users to expand and contract rows and cells by dragging and provides fisheye views of cells and rows. This article also presents the Expanding Calendar, an example application of the Expanding Table.
1. Introduction
This article describes the Expanding Table, a tabular user interface component that enables table cells to expand and contract with smooth animation. The Expanding Table can be used for visualization and browsing applications, and when the user interface component for editing table cell values would make a table prohibitively large. The Expanding Table enables users to expand and contract rows and cells by dragging and provides fisheye views of cells and rows. This article also presents the Expanding Calendar, an example application of the Expanding Table.
Section 2 describes the renderers that paint the cells of an Expanding Table. Section 3 describes how cells can be expanded and contracted with smooth animation programmatically or by user interaction. Section 4 describes how rows can be expanded and contracted, and section 5 describes the Expanding Table’s fisheye views. Finally, section 6 describes the Expanding Calendar, an example application of the Expanding Table.
2. The Expanding Table Cell Renderers
The Expanding Table is implemented by the ExpandingTable class that extends the standard Java Swing JTable class (Geary 1999) to reuse its functionality. The JTable class delegates the painting of table cells to implementations of the Java Swing TableCellRenderer interface (Geary 1999). The TableCellRenderer interface contains the single method
getTableCellRendererComponent(JTable table, Object value,
  boolean isSelected, boolean hasFocus, int row, int column)
that returns the AWT Component that will renderer the cell. The parameters of this method are supplied by a JTable object and enable the correct value to be rendered with appropriate highlighting to indicate whether the cell has focus or is highlighted.
The cells of an Expanding Table are rendered by an implementation of the ExpandingTableCellRenderer interface, an extension of the TableCellRenderer interface that returns a Component that renders the correct representation given the size of the cell. The following code shows the ExpandingTableCellRenderer interface, which adds methods that return the contracted and expanded size of a table cell, and a method that given the height of a table cell, returns the width that maintains the aspect ratio of the rendered object.
public interface ExpandingTableCellRenderer extends TableCellRenderer {
    public Dimension getContractedSize(JTable table, int row, int column);

    public Dimension getExpandedSize(JTable table, int row, int column);

    public int getWidth(JTable table, int row, int column, int rowHeight);
}
The cells in an Expanding Table have contracted and expanded sizes that the table uses to expand the cells. Cells are never expanded past their expanded size or contracted below their contracted size. The aspect ratio of the objects rendered by the Expanding Table is always maintained. The ExpandingTableCellRenderer interface adds methods that return the contracted and expanded size of a cell, and a method that, given a width, returns the corresponding height that maintains the aspect ratio of the object rendered in the cell.
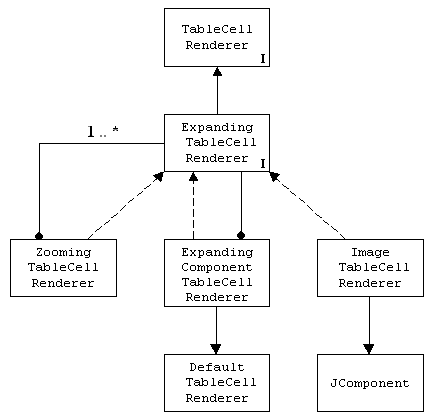
The Expanding Table provides three implementations of the ExpandingTableCellRenderer interface: the ImageTableCellRenderer scales and renders images to fit the current cell size, the ExpandingComponentTableCellRenderer scales and renders AWT Component objects, and the ZoomingTableCellRenderer provides different levels of detail.
2.1 The ImageTableCellRenderer
The ImageTableCellRenderer scales an image to fit the current cell size. Expansion bars are drawn around the image to show the scale of the image in proportion to its expanded size, as shown in the following screenshots. The vertical expansion bar shows the current height of the image as a proportion of its expanded height. The horizontal expansion bar shows the current width of the image as a proportion of its expanded width.
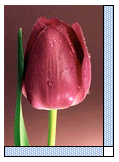
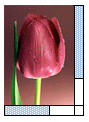

Expansion bars inform the user about the current scale of an image but provide no control over its size. Methods of controlling expansion and contraction are described in sections 3 and 4.
2.2 The ExpandingComponentTableCellRenderer
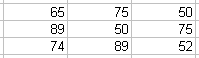
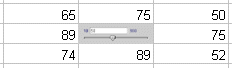
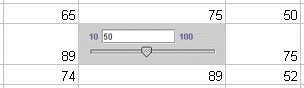
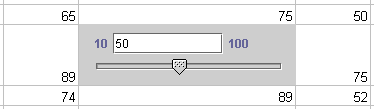
The ExpandingComponentTableCellRenderer wraps a standard Java AWT Component object and scales it to fit the current cell size. The following screenshots show a numeric input component at three different scales. The slider enables the user to select a value in the range 50 to 100. A value can also be entered in the text input box which constrains the value to be within this range. The ExpandingComponentTableCellRenderer enables a Component to be scaled during the stages of animation and will likely be used with the ZoomingTableCellRenderer, described below.


The value of a table cell is edited by first clicking on the cell to display the component that renders the cell editor (Geary 1999). The user edits the value of the cell with this component and a final click indicates that editing is complete. The component used to display a table cell value is usually the same as the component used to edit it. The default table cell editor is a text field. A more complex component is often required to constrain input values for example, and to provide feedback on the progress of editing the cell. If the component above was used to display each value in a table, the table would be very large. The ExpandingComponentTableCellRenderer can be used to minimize the space required for cell value editors by hiding them until needed.
The following screenshots show a small table of nine numeric values that must be constrained to be between 50 and 100 (a). This table is fitted with the ExpandingComponentTableCellRenderer that renders the editor component shown above. When the user clicks on a cell to edit it, the textual value is replaced with the editor component scaled to fit in the cell (b). The expansion of the component is then smoothly animated until it reaches full size when the user can then edit the value (c) and (d). When the value has been edited, the editor component is smoothly contracted to the original size of the cell and is replaced by a textual representation of the new value.
2.3 The ZoomingTableCellRenderer
The ZoomingTableCellRenderer enables expanding table cells to be rendered at different levels of detail. The current size of the cell is the usual criteria for selecting a level of detail, but any criteria can be used and is application specific.
The ZoomingTableCellRenderer maintains a map of LOD objects to ExpandingTableCellRenderer objects. LOD objects determine when an ExpandingTableCellRenderer object should be chosen to render a cell. The LOD interface contains a single method boolean select(JTable table, int row, int column, int width, int height) that returns true if the ExpandingTableCellRenderer object it maps to should be used to render the level of detail. Each LOD object is polled in order and the first object whose select method returns true is used to render the cell. The default table cell renderer is used to render the cell if none of the LOD objects are selected. The following code fragment shows how an implementation of the ExpandingTableCellRenderer interface, DateIconCellRenderer, and an implementation of the LOD interface is added to a ZoomingTableCellRenderer. If the height of the cell is less than 100 pixels or the width is between 50 and 120 pixels, the DateCellRenderer object will render the cell.
ZoomingTableCellRenderer calendarCellRenderer = new ZoomingTableCellRenderer();

calendarCellRenderer.addLOD(
    new DateIconCellRenderer(),
    new LOD() {
        public boolean selectLOD(JTable table,
                                 int row, int column,
                                 int width, int height) {
            return ((height < 100)
                    ||
                    ((width >= 50) && (width <= 120)));
        }
    }
);
The following diagram shows the classes and interfaces of the Expanding Table.
3. Cell Expansion and Contraction
Cells are expanded and contracted programmatically with the void expandCell (int row, int column) and void contractCell(int row, int column) methods of the ExpandingTable class. Calls to expandCell and contractCell are ignored if the cell is already expanded or contracted, respectively.
The ExpandingTable class provides the building blocks for implementing the user interaction required for expanding and contracting table cells, such as clicking on a cell to expand and contract it. The following code fragment shows how expansion invoked by a mouse click would be implemented using methods of the JTable and ExpandingTable classes. The TableMouseListener class is a MouseInputAdaptor that responds to mouse click events when the mouse is over the table. The row and column co-ordinates of the cell in which the mouse was clicked are established. The cell is then expanded if the left mouse button was clicked, or contracted if one of the other mouse buttons was clicked.
class TableMouseListener extends MouseInputAdapter {
    public void mouseClicked(MouseEvent event) {
        Point p = event.getPoint();
        int row = table.rowAtPoint(p);
        int column = table.columnAtPoint(p);
        if (SwingUtilities.isLeftMouseButton(event)) {
            table.expandCell(row, column);
        }
        else {
            table.contractCell(row, column);
        }
    }
}
Cells can be expanded and contracted immediately or with smooth animation, and is selected by calling the void setAnimateExpansion(boolean animateExpansion) method. When the expansion and contraction is animated, the size of the cell is smoothly animated from the current size to the desired size by interpolating intermediate sizes. The animation is produced by a time-based algorithm that must complete the animation in a specified maximum amount of time. Faster machines will be able to complete more interpolated steps in the same amount of time which will produce smoother animation than slower machines.
The interpolated width and height at each stage of the animation is a proportion of the desired width and height, where the proportion is determined by how much time is left to complete the animation. For example, if a and b are values between which interpolated values must be calculated, and t milliseconds remain, the current time-based interpolated value vt is calculated as:
vt = a + [t(b - a)]
The following code fragment shows the algorithm that smoothly animates the size of a cell by interpolating values between its contracted and expanded sizes. While the allotted duration has not elapsed, the next interpolated width and height of the cell (w, h) is calculated. The size of the cell is set to (w, h) with a call to the method void setCellSize(int row, int column, int width, int height).
width = expanded_width - contracted_width;
height = expanded_height - contracted_height;

duration = 1000;
elasped_time = 0;
start_time = get_current_time()

do {
    t = elapsed_time / duration;

    w = contracted_width + (width * t);
    h = contracted_height + (height * t);

    setCellSize(row, column, w, h);

    repaint_table();
}
while (elapsed_time <= duration);
The time taken to animate the expansion and contraction of a cell can be different and is set with calls to void setExpansionDuration(long duration) and void setContractionDuration(long duration). Cell expansion will usually be set to take longer than contraction. A slower expansion enables the user to maintain their awareness of the context of the expanding cell and avoid disorientation. Cells can be contracted faster because the user has completed his or her task with a cell.
4. Row Expansion and Contraction
Columns are the primary organising structure in JTable objects. The Expanding Table increases the importance of rows by enabling users to increase and decrease the size of one or all of the rows with the mouse, and by providing fisheye views of the rows.
Rows can be expanded and contracted by dragging the mouse or by moving the scroll wheel. Rows are expanded by dragging the mouse down in the row and contracted by dragging the mouse up. The row remains in position while the rows above and below it contract to make room or expand back to their preferred size. The scroll wheel can be used as an alternative to dragging: a row is expanded by moving the cursor onto the row and moving the wheel down, and is contracted by moving the wheel up.
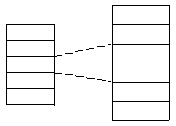
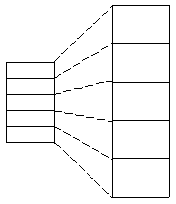
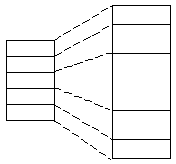
Diagram (a) below illustrates single row expansion: one row is expanded and the other rows are held constant. Diagram (b) shows all rows expanded by the same amount.
To enable an ExpandingTable object to co-ordinate other components, it fires an event whenever the height of a row changes. Interested clients implement the ExpandingTableEventListener interface and receive an ExpandingTableEvent object that provides the number of the row whose height has changed.
Rows can also be expanded with the fisheye transformation described in the next section.
5. Fisheye Views
The Expanding Table provides fisheye views of the rows and cells. Fisheye lenses are an established visualization technique that enlarge the information at the focus of the lens and reduce the size of the information towards the periphery (Sarkar and Brown, 1992).
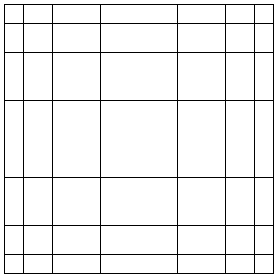
The following diagrams illustrate the two fisheye views provided by the Expanding Table. Diagram (a) shows the row fisheye view: the row at the focus of the lens is expanded fully and the rows above and below are partially expanded in decreasing amounts. Diagram (b) shows the cell fisheye view: the cell at the focus of the lens is expanded fully and the rows above and below, and the columns to the left and right are partially expanded in decreasing amounts.
6. The Expanding Calendar
The Expanding Calendar is an example application of the Expanding Table. Details of appointments are shown by expanding the cell that contains the appointments and contracting the cells that contain unnecessary detail. The Expanding Calendar is based on the Fisheye Calendar developed by Bederson et al. (2002) to test their implementation of a zooming user interface for a personal digital assistant.
The following screenshot shows the Expanding Calendar application for 2002. The first column shows the months and the rows of this column span the weeks of each month. The next column shows the 52 weeks of the year. The remaining columns show the days of the week.
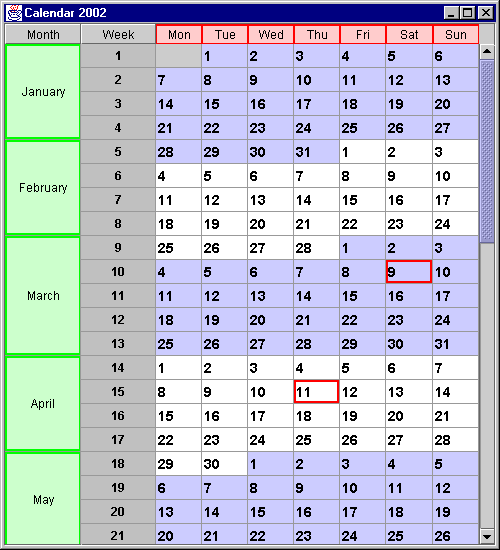
Each table cell in the days of the week columns represent one day broken up into one hour appointments from 0900 to 1800. The table cells that represent dates are coloured blue and white in alternate months. Important dates are highlighted with a red border. The user clicks on a date to view and edit the appointments for that day. The width of the table is held constant by reducing the width of the other columns that represent days of the week. The following screenshot shows the appointments for the 6th of February.

The Expanding Table renders a different presentation of a date depending on the current size of the cell. As the window containing the Expanding Calendar is resized, the cells are rendered to show the appropriate level of detail for their size. Each calendar table cell that represents a date is rendered by a ZoomingTableCellRenderer object that provides the three levels of detail shown in the following screenshots: small (a), medium (b), and large (c). The small level of detail, rendered by a DateCellRenderer object, shows only the date and is used when the width of the cell is less than 50 pixels.

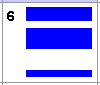
The medium level of detail, rendered by a DateIconCellRenderer object, provides the date and a visualization of the entries for that date. To the right of the date is a rectangle that contains horizontal lines that indicate that appointments have been made in the time slots they represent. The thickness of the lines increases as the height of the cell increases. The medium level of detail is used when the width of the cell is between 50 and 120 pixels and the height is less than 120 pixels.
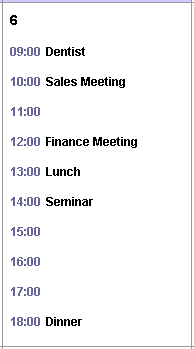
The large level of detail is rendered by an ExpandingComponentTableCellRenderer object that wraps a DayEntryPanel object that presents the text of the appointments. The ExpandingComponentTableCellRenderer scales the DayEntryPanel component to fit the size of the cell. The large representation is used when the width of the cell is more than 120 pixels and the height is more than 100 pixels.
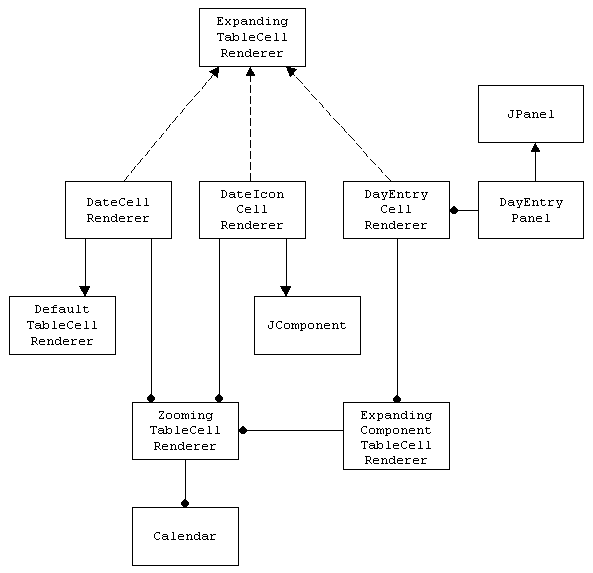
The following diagram shows the classes and interfaces of the Expanding Calendar application.
References
- Bederson, B. B., M. P. Czerwinski and G. R. Robertson, A Fisheye Calendar Interface for PDAs: Providing Overviews for Small Displays, University of Maryland HCIL Tech Report #HCIL-2002-09, May 2002.
- Geary, D. M., Graphic Java 2 Mastering the JFC, Volume II: Swing, 3rd edition, Prentice-Hall, 1999.
- Sarkar, M. and M. H. Brown, “Graphical Fisheye Views of Graphs”, In Proceedings of Human Factors in Computer Systems (CHI ‘92), 1992: 83-91.